
|
China Resources Land Limited (1109.HK) Avaliação DCF |
Totalmente Editável: Adapte-Se Às Suas Necessidades No Excel Ou Planilhas
Design Profissional: Modelos Confiáveis E Padrão Da Indústria
Pré-Construídos Para Uso Rápido E Eficiente
Compatível com MAC/PC, totalmente desbloqueado
Não É Necessária Experiência; Fácil De Seguir
China Resources Land Limited (1109.HK) Bundle
Descubra o verdadeiro valor da China Resources Land Limited (1109HK) com a nossa calculadora DCF de nível especializado! Ajuste as principais suposições, explore vários cenários e avalie como diferentes mudanças influenciam a avaliação da China Recursos Land Limited (1109HK) - tudo dentro de um modelo conveniente do Excel.
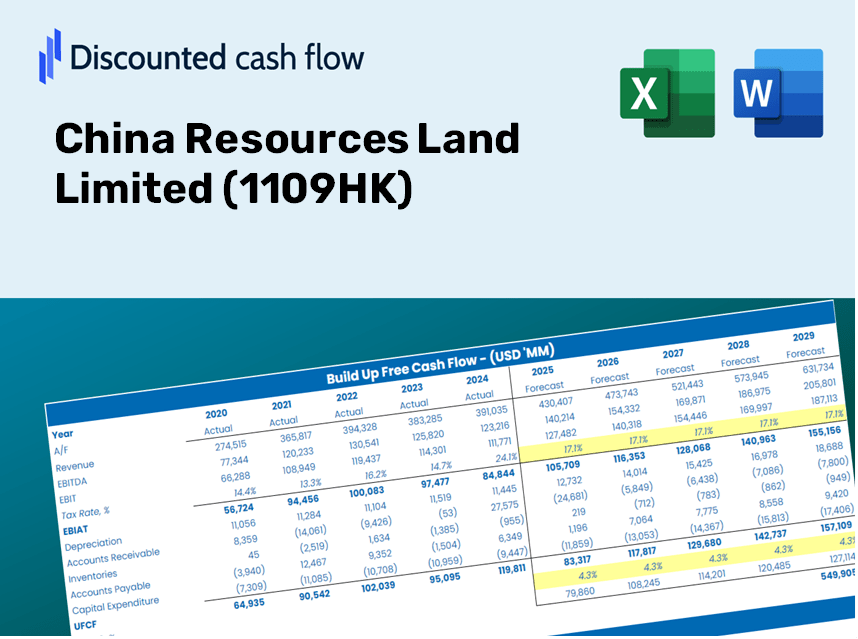
Discounted Cash Flow (DCF) - (USD MM)
| Year | AY1 2020 |
AY2 2021 |
AY3 2022 |
AY4 2023 |
AY5 2024 |
FY1 2025 |
FY2 2026 |
FY3 2027 |
FY4 2028 |
FY5 2029 |
|---|---|---|---|---|---|---|---|---|---|---|
| Revenue | 196,463.5 | 232,040.6 | 226,519.1 | 274,737.0 | 304,998.8 | 328,044.6 | 352,831.7 | 379,491.7 | 408,166.1 | 439,007.2 |
| Revenue Growth, % | 0 | 18.11 | -2.38 | 21.29 | 11.01 | 7.56 | 7.56 | 7.56 | 7.56 | 7.56 |
| EBITDA | 57,481.9 | 68,813.0 | 63,869.5 | 75,842.5 | 68,604.9 | 90,021.3 | 96,823.3 | 104,139.3 | 112,008.1 | 120,471.4 |
| EBITDA, % | 29.26 | 29.66 | 28.2 | 27.61 | 22.49 | 27.44 | 27.44 | 27.44 | 27.44 | 27.44 |
| Depreciation | 1,138.9 | 1,428.5 | 1,458.5 | 1,435.9 | 1,674.5 | 1,909.8 | 2,054.1 | 2,209.3 | 2,376.2 | 2,555.8 |
| Depreciation, % | 0.57969 | 0.61561 | 0.64388 | 0.52266 | 0.54903 | 0.58217 | 0.58217 | 0.58217 | 0.58217 | 0.58217 |
| EBIT | 56,343.0 | 67,384.6 | 62,411.0 | 74,406.6 | 66,930.4 | 88,111.5 | 94,769.2 | 101,930.0 | 109,631.9 | 117,915.7 |
| EBIT, % | 28.68 | 29.04 | 27.55 | 27.08 | 21.94 | 26.86 | 26.86 | 26.86 | 26.86 | 26.86 |
| Total Cash | 100,993.2 | 118,160.2 | 105,690.2 | 130,980.5 | 149,905.8 | 161,273.7 | 173,459.6 | 186,566.2 | 200,663.1 | 215,825.3 |
| Total Cash, percent | .0 | .0 | .0 | .0 | .0 | .0 | .0 | .0 | .0 | .0 |
| Account Receivables | 67,455.7 | 67,136.9 | 85,679.1 | 93,046.6 | 84,795.8 | 106,786.4 | 114,855.1 | 123,533.6 | 132,867.8 | 142,907.3 |
| Account Receivables, % | 34.33 | 28.93 | 37.82 | 33.87 | 27.8 | 32.55 | 32.55 | 32.55 | 32.55 | 32.55 |
| Inventories | 412,526.3 | 440,899.8 | 542,567.6 | 574,051.1 | 482,714.8 | 328,044.6 | 352,831.7 | 379,491.7 | 408,166.1 | 439,007.2 |
| Inventories, % | 209.98 | 190.01 | 239.52 | 208.95 | 158.27 | 100 | 100 | 100 | 100 | 100 |
| Accounts Payable | 95,479.9 | 100,232.1 | 109,297.5 | 92,160.0 | 74,622.0 | 129,943.2 | 139,761.7 | 150,322.1 | 161,680.5 | 173,897.1 |
| Accounts Payable, % | 48.6 | 43.2 | 48.25 | 33.54 | 24.47 | 39.61 | 39.61 | 39.61 | 39.61 | 39.61 |
| Capital Expenditure | -3,336.9 | -2,401.9 | -2,118.8 | -1,378.9 | -1,056.4 | -2,963.7 | -3,187.7 | -3,428.6 | -3,687.6 | -3,966.3 |
| Capital Expenditure, % | -1.7 | -1.04 | -0.93539 | -0.5019 | -0.34637 | -0.90346 | -0.90346 | -0.90346 | -0.90346 | -0.90346 |
| Tax Rate, % | 56.07 | 56.07 | 56.07 | 56.07 | 56.07 | 56.07 | 56.07 | 56.07 | 56.07 | 56.07 |
| EBITAT | 28,119.5 | 36,168.6 | 31,584.6 | 35,127.4 | 29,399.9 | 43,232.1 | 46,498.8 | 50,012.2 | 53,791.1 | 57,855.6 |
| Depreciation | ||||||||||
| Changes in Account Receivables | ||||||||||
| Changes in Inventories | ||||||||||
| Changes in Accounts Payable | ||||||||||
| Capital Expenditure | ||||||||||
| UFCF | -358,580.7 | 11,892.7 | -80,220.3 | -20,804.1 | 112,067.1 | 230,179.0 | 22,327.8 | 24,014.9 | 25,829.5 | 27,781.1 |
| WACC, % | 3.7 | 3.77 | 3.71 | 3.64 | 3.57 | 3.68 | 3.68 | 3.68 | 3.68 | 3.68 |
| PV UFCF | ||||||||||
| SUM PV UFCF | 309,882.4 | |||||||||
| Long Term Growth Rate, % | 3.00 | |||||||||
| Free cash flow (T + 1) | 28,615 | |||||||||
| Terminal Value | 4,224,064 | |||||||||
| Present Terminal Value | 3,526,222 | |||||||||
| Enterprise Value | 3,836,104 | |||||||||
| Net Debt | 147,686 | |||||||||
| Equity Value | 3,688,418 | |||||||||
| Diluted Shares Outstanding, MM | 7,131 | |||||||||
| Equity Value Per Share | 517.24 |
Benefits You'll Receive
- Authentic 1109HK Financial Data: Pre-loaded with China Resources Land Limited's historical and forecasted data for accurate analysis.
- Completely Customizable Template: Easily adjust essential inputs like revenue growth, WACC, and EBITDA percentage.
- Instant Calculations: Watch the intrinsic value of China Resources Land Limited update in real time with your modifications.
- Professional Valuation Tool: Tailored for investors, analysts, and consultants pursuing precise DCF outcomes.
- Intuitive Design: Streamlined layout and straightforward instructions catering to all skill levels.
Key Features
- Real-Life 1109HK Data: Pre-filled with China Resources Land Limited's historical financials and forward-looking projections.
- Fully Customizable Inputs: Adjust revenue growth, profit margins, discount rates, tax considerations, and capital expenditures.
- Dynamic Valuation Model: Automatic updates to Net Present Value (NPV) and intrinsic value based on your customized inputs.
- Scenario Testing: Create multiple forecast scenarios to evaluate various valuation outcomes.
- User-Friendly Design: Intuitive, organized, and crafted for both seasoned professionals and newcomers.
How It Operates
- Step 1: Download the Excel file.
- Step 2: Examine the pre-filled data for China Resources Land Limited (1109HK) including historical and forecasted figures.
- Step 3: Modify key assumptions (highlighted yellow cells) to reflect your analysis.
- Step 4: Observe the automatic updates for the intrinsic value of China Resources Land Limited (1109HK).
- Step 5: Utilize the results for your investment choices or reporting purposes.
Why Opt for This Calculator?
- All-in-One Solution: Offers DCF, WACC, and financial ratio assessments in a single tool.
- Flexible Inputs: Modify the yellow-highlighted cells to explore different scenarios.
- In-Depth Analysis: Automatically computes China Resources Land Limited’s intrinsic value and Net Present Value.
- Preloaded Information: Comes with historical and projected data to provide accurate baselines.
- High-Quality Standards: Perfect for financial analysts, investors, and business advisors.
Who Should Consider This Product?
- Finance Students: Discover valuation methodologies and implement them with actual market data.
- Researchers: Integrate industry-standard models into academic studies or presentations.
- Investors: Validate your investment hypotheses and assess valuation results for China Resources Land Limited (1109HK).
- Financial Analysts: Enhance your efficiency with a ready-made, customizable DCF model tailored for your analysis.
- Entrepreneurs: Understand the evaluation processes used for major public companies like China Resources Land Limited (1109HK).
Contents of the Template
- Historical Data: Contains China Resources Land Limited’s (1109HK) previous financial results and foundational forecasts.
- DCF and Levered DCF Models: Comprehensive templates for assessing the intrinsic value of China Resources Land Limited (1109HK).
- WACC Sheet: Pre-prepared calculations for the Weighted Average Cost of Capital.
- Editable Inputs: Adjust key factors such as growth rates, EBITDA percentages, and CAPEX assumptions.
- Quarterly and Annual Statements: An extensive overview of China Resources Land Limited’s (1109HK) financial performance.
- Interactive Dashboard: Dynamically visualize valuation outcomes and future projections.
Disclaimer
All information, articles, and product details provided on this website are for general informational and educational purposes only. We do not claim any ownership over, nor do we intend to infringe upon, any trademarks, copyrights, logos, brand names, or other intellectual property mentioned or depicted on this site. Such intellectual property remains the property of its respective owners, and any references here are made solely for identification or informational purposes, without implying any affiliation, endorsement, or partnership.
We make no representations or warranties, express or implied, regarding the accuracy, completeness, or suitability of any content or products presented. Nothing on this website should be construed as legal, tax, investment, financial, medical, or other professional advice. In addition, no part of this site—including articles or product references—constitutes a solicitation, recommendation, endorsement, advertisement, or offer to buy or sell any securities, franchises, or other financial instruments, particularly in jurisdictions where such activity would be unlawful.
All content is of a general nature and may not address the specific circumstances of any individual or entity. It is not a substitute for professional advice or services. Any actions you take based on the information provided here are strictly at your own risk. You accept full responsibility for any decisions or outcomes arising from your use of this website and agree to release us from any liability in connection with your use of, or reliance upon, the content or products found herein.