
|
Zoomlion Heavy Industry Science and Technology Co., Ltd. (1157.hk) Avaliação DCF |
Totalmente Editável: Adapte-Se Às Suas Necessidades No Excel Ou Planilhas
Design Profissional: Modelos Confiáveis E Padrão Da Indústria
Pré-Construídos Para Uso Rápido E Eficiente
Compatível com MAC/PC, totalmente desbloqueado
Não É Necessária Experiência; Fácil De Seguir
Zoomlion Heavy Industry Science and Technology Co., Ltd. (1157.HK) Bundle
Aprimore suas opções de investimento com a calculadora DCF da Zoomlion Heavy Industry Science Co., Ltd. (1157HK)! Explore dados financeiros autênticos, ajuste as previsões e despesas do crescimento e observe instantaneamente como essas modificações afetam o valor intrínseco do Zoomlion (1157HK).
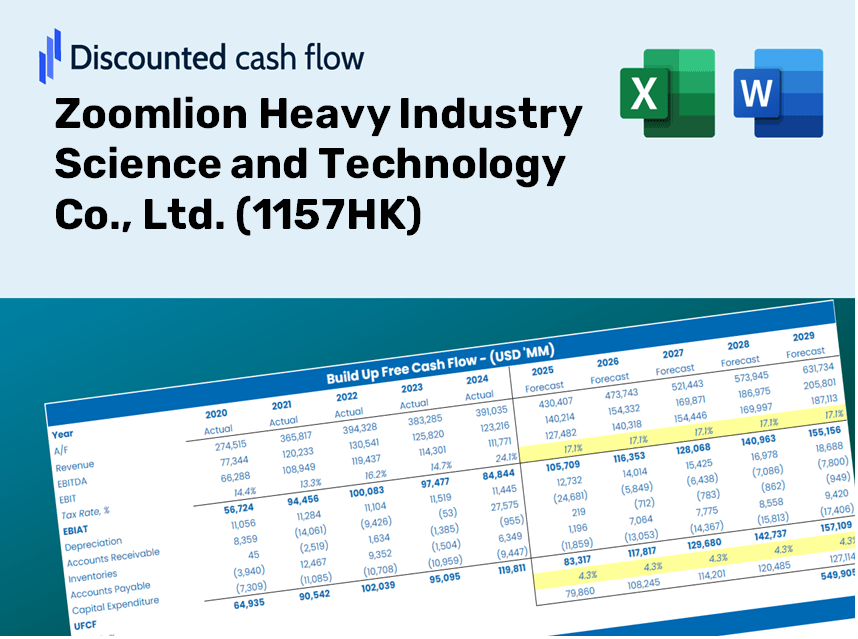
Discounted Cash Flow (DCF) - (USD MM)
| Year | AY1 2020 |
AY2 2021 |
AY3 2022 |
AY4 2023 |
AY5 2024 |
FY1 2025 |
FY2 2026 |
FY3 2027 |
FY4 2028 |
FY5 2029 |
|---|---|---|---|---|---|---|---|---|---|---|
| Revenue | 71,071.9 | 73,278.7 | 45,444.3 | 51,386.2 | 49,643.3 | 46,516.2 | 43,586.2 | 40,840.7 | 38,268.1 | 35,857.6 |
| Revenue Growth, % | 0 | 3.11 | -37.98 | 13.08 | -3.39 | -6.3 | -6.3 | -6.3 | -6.3 | -6.3 |
| EBITDA | 11,293.7 | 9,240.0 | 4,543.8 | 6,886.1 | 6,871.6 | 6,116.1 | 5,730.8 | 5,369.8 | 5,031.6 | 4,714.6 |
| EBITDA, % | 15.89 | 12.61 | 10 | 13.4 | 13.84 | 13.15 | 13.15 | 13.15 | 13.15 | 13.15 |
| Depreciation | 992.1 | 950.1 | 928.1 | 1,517.4 | 1,463.8 | 989.5 | 927.2 | 868.8 | 814.1 | 762.8 |
| Depreciation, % | 1.4 | 1.3 | 2.04 | 2.95 | 2.95 | 2.13 | 2.13 | 2.13 | 2.13 | 2.13 |
| EBIT | 10,301.6 | 8,289.9 | 3,615.7 | 5,368.7 | 5,407.7 | 5,126.5 | 4,803.6 | 4,501.0 | 4,217.5 | 3,951.8 |
| EBIT, % | 14.49 | 11.31 | 7.96 | 10.45 | 10.89 | 11.02 | 11.02 | 11.02 | 11.02 | 11.02 |
| Total Cash | 18,303.0 | 23,550.4 | 21,295.9 | 19,252.9 | 16,747.4 | 16,369.6 | 15,338.4 | 14,372.3 | 13,467.0 | 12,618.7 |
| Total Cash, percent | .0 | .0 | .0 | .0 | .0 | .0 | .0 | .0 | .0 | .0 |
| Account Receivables | 49,790.4 | 36,250.5 | 36,975.1 | 33,872.4 | 29,324.9 | 30,317.2 | 28,407.6 | 26,618.2 | 24,941.5 | 23,370.4 |
| Account Receivables, % | 70.06 | 49.47 | 81.36 | 65.92 | 59.07 | 65.18 | 65.18 | 65.18 | 65.18 | 65.18 |
| Inventories | 15,994.3 | 14,738.0 | 15,503.4 | 24,564.5 | 24,630.0 | 16,201.6 | 15,181.0 | 14,224.8 | 13,328.8 | 12,489.2 |
| Inventories, % | 22.5 | 20.11 | 34.12 | 47.8 | 49.61 | 34.83 | 34.83 | 34.83 | 34.83 | 34.83 |
| Accounts Payable | 35,568.4 | 32,673.3 | 28,919.9 | 25,161.3 | 18,243.6 | 22,698.6 | 21,268.8 | 19,929.1 | 18,673.8 | 17,497.5 |
| Accounts Payable, % | 50.05 | 44.59 | 63.64 | 48.97 | 36.75 | 48.8 | 48.8 | 48.8 | 48.8 | 48.8 |
| Capital Expenditure | -1,201.8 | -3,180.4 | -1,669.9 | -2,074.0 | -4,404.9 | -2,103.9 | -1,971.4 | -1,847.2 | -1,730.9 | -1,621.8 |
| Capital Expenditure, % | -1.69 | -4.34 | -3.67 | -4.04 | -8.87 | -4.52 | -4.52 | -4.52 | -4.52 | -4.52 |
| Tax Rate, % | 19.68 | 19.68 | 19.68 | 19.68 | 19.68 | 19.68 | 19.68 | 19.68 | 19.68 | 19.68 |
| EBITAT | 8,669.0 | 7,096.9 | 3,374.8 | 4,452.4 | 4,343.4 | 4,371.4 | 4,096.0 | 3,838.0 | 3,596.3 | 3,369.7 |
| Depreciation | ||||||||||
| Changes in Account Receivables | ||||||||||
| Changes in Inventories | ||||||||||
| Changes in Accounts Payable | ||||||||||
| Capital Expenditure | ||||||||||
| UFCF | -21,756.9 | 16,767.7 | -2,610.4 | -5,821.2 | -1,033.4 | 15,148.2 | 4,552.3 | 4,265.5 | 3,996.8 | 3,745.1 |
| WACC, % | 6.13 | 6.14 | 6.2 | 6.12 | 6.09 | 6.14 | 6.14 | 6.14 | 6.14 | 6.14 |
| PV UFCF | ||||||||||
| SUM PV UFCF | 27,811.8 | |||||||||
| Long Term Growth Rate, % | 2.00 | |||||||||
| Free cash flow (T + 1) | 3,820 | |||||||||
| Terminal Value | 92,372 | |||||||||
| Present Terminal Value | 68,587 | |||||||||
| Enterprise Value | 96,398 | |||||||||
| Net Debt | 3,799 | |||||||||
| Equity Value | 92,599 | |||||||||
| Diluted Shares Outstanding, MM | 8,586 | |||||||||
| Equity Value Per Share | 10.78 |
What You Will Receive
- Authentic Zoomlion Data: Preloaded financial information – encompassing revenue to EBIT – derived from actual and projected figures.
- Complete Customization: Modify all key parameters (yellow cells) such as WACC, growth %, and tax rates to suit your analysis.
- Instant Valuation Updates: Automatic recalculations to assess the impact of changes on Zoomlion's fair value.
- Flexible Excel Template: Designed for easy edits, scenario analysis, and comprehensive projections.
- Efficient and Precise: Eliminate the need to build models from scratch while ensuring accuracy and adaptability.
Key Features
- Pre-Loaded Data: Access Zoomlion Heavy Industry's historical financial statements and forecast data.
- Fully Customizable Inputs: Modify WACC, tax rates, revenue growth, and EBITDA margins as needed.
- Real-Time Results: Watch the intrinsic value of Zoomlion recalculated instantly.
- Intuitive Visual Outputs: Dashboard graphs present valuation results and essential metrics clearly.
- Designed for Precision: A professional-grade tool for analysts, investors, and finance professionals.
How It Works
- 1. Access the Template: Download and open the Excel file containing Zoomlion Heavy Industry Science and Technology Co., Ltd.'s preloaded data.
- 2. Modify Key Assumptions: Adjust important inputs such as growth rates, WACC, and capital expenditures.
- 3. Instant Results: The DCF model automatically computes intrinsic value and NPV as you make changes.
- 4. Explore Different Scenarios: Evaluate various forecasts to understand different valuation results.
- 5. Confidently Present Insights: Share professional valuation findings to inform your decision-making process.
Why Opt for This Calculator?
- Designed for Industry Experts: A sophisticated tool preferred by analysts, CFOs, and industry consultants.
- Comprehensive Data: Zoomlion's historical and projected financials preloaded for precise calculations.
- Flexible Scenario Analysis: Effortlessly simulate various forecasts and assumptions.
- Clear Results: Automatically computes intrinsic value, NPV, and essential metrics.
- User-Friendly: Step-by-step guidance makes the process straightforward.
Who Should Consider Zoomlion Heavy Industry Science and Technology Co., Ltd. (1157HK)?
- Investors: Make informed investment choices with insights from a leading heavy machinery manufacturer.
- Market Analysts: Gain efficiency with readily available data and market trends tailored for the construction sector.
- Consultants: Easily adapt findings into impactful client presentations or strategic reports.
- Construction Industry Professionals: Enhance your understanding of market dynamics and technological advancements in heavy machinery.
- Students and Educators: Utilize it as a valuable resource for learning about industrial applications and market strategies.
Contents of the Template
- Operating and Balance Sheet Data: Pre-filled historical data and forecasts for Zoomlion Heavy Industry Science and Technology Co., Ltd. (1157HK), including revenue, EBITDA, EBIT, and capital expenditures.
- WACC Calculation: A dedicated sheet for calculating the Weighted Average Cost of Capital (WACC), featuring parameters such as Beta, risk-free rate, and share price.
- DCF Valuation (Unlevered and Levered): Customizable Discounted Cash Flow models that reveal intrinsic value with comprehensive calculations.
- Financial Statements: Pre-loaded financial statements (annual and quarterly) to facilitate thorough analysis.
- Key Ratios: A selection of profitability, leverage, and efficiency ratios specific to Zoomlion Heavy Industry Science and Technology Co., Ltd. (1157HK).
- Dashboard and Charts: A visual overview of valuation outcomes and assumptions for easy result analysis.
Disclaimer
All information, articles, and product details provided on this website are for general informational and educational purposes only. We do not claim any ownership over, nor do we intend to infringe upon, any trademarks, copyrights, logos, brand names, or other intellectual property mentioned or depicted on this site. Such intellectual property remains the property of its respective owners, and any references here are made solely for identification or informational purposes, without implying any affiliation, endorsement, or partnership.
We make no representations or warranties, express or implied, regarding the accuracy, completeness, or suitability of any content or products presented. Nothing on this website should be construed as legal, tax, investment, financial, medical, or other professional advice. In addition, no part of this site—including articles or product references—constitutes a solicitation, recommendation, endorsement, advertisement, or offer to buy or sell any securities, franchises, or other financial instruments, particularly in jurisdictions where such activity would be unlawful.
All content is of a general nature and may not address the specific circumstances of any individual or entity. It is not a substitute for professional advice or services. Any actions you take based on the information provided here are strictly at your own risk. You accept full responsibility for any decisions or outcomes arising from your use of this website and agree to release us from any liability in connection with your use of, or reliance upon, the content or products found herein.