
|
NEXTEER AUTOMOTIVE GRUPE LIMITED (1316.HK) Avaliação DCF |
Totalmente Editável: Adapte-Se Às Suas Necessidades No Excel Ou Planilhas
Design Profissional: Modelos Confiáveis E Padrão Da Indústria
Pré-Construídos Para Uso Rápido E Eficiente
Compatível com MAC/PC, totalmente desbloqueado
Não É Necessária Experiência; Fácil De Seguir
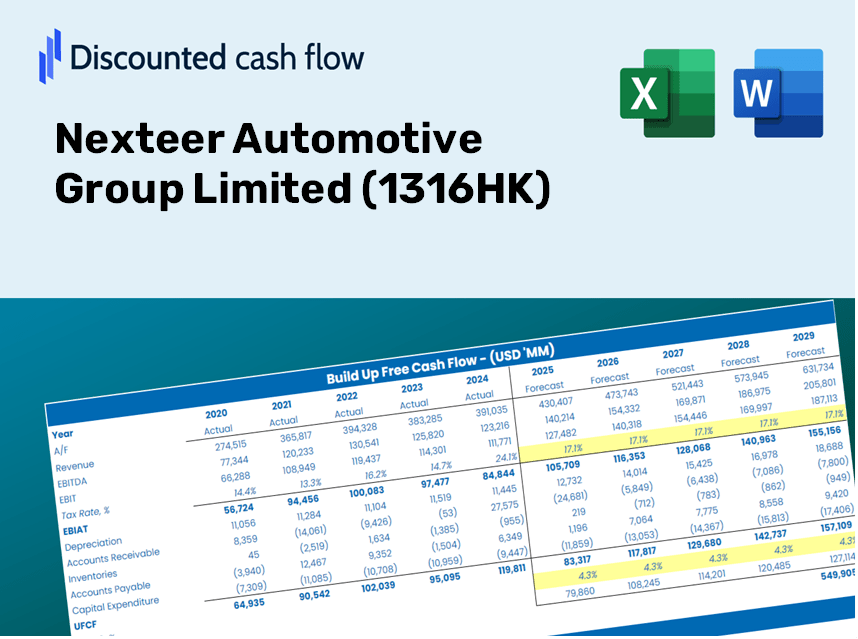
Nexteer Automotive Group Limited (1316.HK) Bundle
Aprimore sua estratégia de investimento com a calculadora DCF (1316HK)! Utilize dados financeiros reais do Nexteer Automotive Group Limited, ajuste as projeções e despesas de crescimento e observe instantaneamente como essas alterações afetam o valor intrínseco de (1316HK).
Discounted Cash Flow (DCF) - (USD MM)
| Year | AY1 2020 |
AY2 2021 |
AY3 2022 |
AY4 2023 |
AY5 2024 |
FY1 2025 |
FY2 2026 |
FY3 2027 |
FY4 2028 |
FY5 2029 |
|---|---|---|---|---|---|---|---|---|---|---|
| Revenue | 23,560.3 | 26,097.3 | 29,834.5 | 32,686.8 | 33,225.2 | 36,240.1 | 39,528.5 | 43,115.3 | 47,027.6 | 51,294.9 |
| Revenue Growth, % | 0 | 10.77 | 14.32 | 9.56 | 1.65 | 9.07 | 9.07 | 9.07 | 9.07 | 9.07 |
| EBITDA | 2,710.9 | 2,875.6 | 2,818.5 | 2,777.6 | 2,347.0 | 3,445.2 | 3,757.9 | 4,098.9 | 4,470.8 | 4,876.5 |
| EBITDA, % | 11.51 | 11.02 | 9.45 | 8.5 | 7.06 | 9.51 | 9.51 | 9.51 | 9.51 | 9.51 |
| Depreciation | 1,776.0 | 1,963.9 | 2,091.6 | 2,268.0 | 1,071.1 | 2,336.5 | 2,548.5 | 2,779.8 | 3,032.0 | 3,307.2 |
| Depreciation, % | 7.54 | 7.53 | 7.01 | 6.94 | 3.22 | 6.45 | 6.45 | 6.45 | 6.45 | 6.45 |
| EBIT | 934.9 | 911.7 | 726.9 | 509.6 | 1,275.9 | 1,108.7 | 1,209.3 | 1,319.1 | 1,438.8 | 1,569.3 |
| EBIT, % | 3.97 | 3.49 | 2.44 | 1.56 | 3.84 | 3.06 | 3.06 | 3.06 | 3.06 | 3.06 |
| Total Cash | 4,300.1 | 2,537.0 | 1,910.9 | 2,422.2 | 3,281.1 | 3,744.6 | 4,084.4 | 4,455.0 | 4,859.2 | 5,300.2 |
| Total Cash, percent | .0 | .0 | .0 | .0 | .0 | .0 | .0 | .0 | .0 | .0 |
| Account Receivables | 4,607.8 | 4,864.6 | 5,851.6 | 5,831.4 | 7,593.3 | 7,139.7 | 7,787.6 | 8,494.2 | 9,265.0 | 10,105.7 |
| Account Receivables, % | 19.56 | 18.64 | 19.61 | 17.84 | 22.85 | 19.7 | 19.7 | 19.7 | 19.7 | 19.7 |
| Inventories | 1,818.5 | 2,242.7 | 2,282.0 | 2,323.8 | 2,205.3 | 2,733.1 | 2,981.1 | 3,251.6 | 3,546.6 | 3,868.4 |
| Inventories, % | 7.72 | 8.59 | 7.65 | 7.11 | 6.64 | 7.54 | 7.54 | 7.54 | 7.54 | 7.54 |
| Accounts Payable | 5,106.1 | 5,178.7 | 6,335.7 | 6,475.5 | 6,784.6 | 7,464.2 | 8,141.5 | 8,880.3 | 9,686.1 | 10,565.0 |
| Accounts Payable, % | 21.67 | 19.84 | 21.24 | 19.81 | 20.42 | 20.6 | 20.6 | 20.6 | 20.6 | 20.6 |
| Capital Expenditure | -1,163.5 | -1,100.2 | -935.1 | -2,425.9 | -2,186.1 | -1,905.5 | -2,078.4 | -2,267.0 | -2,472.7 | -2,697.0 |
| Capital Expenditure, % | -4.94 | -4.22 | -3.13 | -7.42 | -6.58 | -5.26 | -5.26 | -5.26 | -5.26 | -5.26 |
| Tax Rate, % | 47.35 | 47.35 | 47.35 | 47.35 | 47.35 | 47.35 | 47.35 | 47.35 | 47.35 | 47.35 |
| EBITAT | 953.7 | 947.1 | 458.6 | 291.5 | 671.7 | 827.0 | 902.0 | 983.9 | 1,073.1 | 1,170.5 |
| Depreciation | ||||||||||
| Changes in Account Receivables | ||||||||||
| Changes in Inventories | ||||||||||
| Changes in Accounts Payable | ||||||||||
| Capital Expenditure | ||||||||||
| UFCF | 246.0 | 1,202.5 | 1,745.8 | 251.9 | -1,777.7 | 1,863.5 | 1,153.6 | 1,258.3 | 1,372.5 | 1,497.0 |
| WACC, % | 10.25 | 10.25 | 10.19 | 10.18 | 10.18 | 10.21 | 10.21 | 10.21 | 10.21 | 10.21 |
| PV UFCF | ||||||||||
| SUM PV UFCF | 5,431.9 | |||||||||
| Long Term Growth Rate, % | 3.50 | |||||||||
| Free cash flow (T + 1) | 1,549 | |||||||||
| Terminal Value | 23,098 | |||||||||
| Present Terminal Value | 14,207 | |||||||||
| Enterprise Value | 19,639 | |||||||||
| Net Debt | -2,569 | |||||||||
| Equity Value | 22,209 | |||||||||
| Diluted Shares Outstanding, MM | 2,510 | |||||||||
| Equity Value Per Share | 8.85 |
What You Will Receive
- Authentic NXTHK Financial Data: Pre-loaded with Nexteer’s historical and projected figures for accurate analysis.
- Completely Customizable Template: Easily adjust essential inputs like revenue growth, WACC, and EBITDA percentage.
- Instant Calculations: View Nexteer’s intrinsic value in real-time as you make modifications.
- Expert Valuation Tool: Tailored for investors, analysts, and consultants aiming for precise DCF outcomes.
- User-Friendly Interface: Intuitive layout and straightforward guidance suitable for all skill levels.
Highlights
- Comprehensive Historical Data: Nexteer's historical financial reports and pre-populated forecasts.
- Customizable Parameters: Adjust WACC, tax rates, revenue growth, and EBITDA margins to fit your analysis.
- Real-Time Insights: Watch Nexteer’s intrinsic value update instantly with your adjustments.
- Visual Data Representation: Intuitive dashboard charts showcase valuation outcomes and essential metrics.
- Designed for Precision: A professional-grade tool tailored for analysts, investors, and finance professionals.
How It Functions
- Download: Get the pre-configured Excel spreadsheet featuring Nexteer Automotive Group Limited's (1316HK) financial data.
- Customize: Modify projections, such as revenue growth, EBITDA %, and WACC.
- Update Automatically: Benefit from real-time updates for intrinsic value and NPV calculations.
- Test Scenarios: Generate various projections and instantly compare the results.
- Make Decisions: Leverage the valuation insights to inform your investment strategy.
Why Choose This Calculator for Nexteer Automotive Group Limited (1316HK)?
- Accurate Data: Utilize real financials from Nexteer for dependable valuation outcomes.
- Customizable: Modify essential parameters such as growth rates, WACC, and tax rates to align with your forecasts.
- Time-Saving: Ready-made calculations streamline the process, so you don’t have to begin from scratch.
- Professional-Grade Tool: Tailored for investors, analysts, and consultants in the automotive sector.
- User-Friendly: The intuitive design and step-by-step guidance make it accessible for all users.
Who Should Utilize This Product?
- Investors: Accurately assess the fair value of Nexteer Automotive Group Limited (1316HK) prior to making investment choices.
- CFOs: Utilize a high-quality DCF model for comprehensive financial reporting and analysis.
- Consultants: Efficiently customize the template for client valuation reports.
- Entrepreneurs: Acquire insights into the financial modeling practices of leading automotive companies.
- Educators: Employ it as a resource for teaching valuation techniques and methodologies.
Contents of the Template
- Operating and Balance Sheet Data: Pre-filled historical data and forecasts for Nexteer Automotive Group Limited (1316HK), including revenue, EBITDA, EBIT, and capital expenditures.
- WACC Calculation: A dedicated sheet for calculating the Weighted Average Cost of Capital (WACC), incorporating parameters like Beta, risk-free rate, and share price.
- DCF Valuation (Unlevered and Levered): Customizable Discounted Cash Flow models that display intrinsic value along with comprehensive calculations.
- Financial Statements: Pre-loaded annual and quarterly financial statements to facilitate detailed analysis.
- Key Ratios: A collection of profitability, leverage, and efficiency ratios specifically for Nexteer Automotive Group Limited (1316HK).
- Dashboard and Charts: A visual overview of valuation results and assumptions for straightforward analysis.
Disclaimer
All information, articles, and product details provided on this website are for general informational and educational purposes only. We do not claim any ownership over, nor do we intend to infringe upon, any trademarks, copyrights, logos, brand names, or other intellectual property mentioned or depicted on this site. Such intellectual property remains the property of its respective owners, and any references here are made solely for identification or informational purposes, without implying any affiliation, endorsement, or partnership.
We make no representations or warranties, express or implied, regarding the accuracy, completeness, or suitability of any content or products presented. Nothing on this website should be construed as legal, tax, investment, financial, medical, or other professional advice. In addition, no part of this site—including articles or product references—constitutes a solicitation, recommendation, endorsement, advertisement, or offer to buy or sell any securities, franchises, or other financial instruments, particularly in jurisdictions where such activity would be unlawful.
All content is of a general nature and may not address the specific circumstances of any individual or entity. It is not a substitute for professional advice or services. Any actions you take based on the information provided here are strictly at your own risk. You accept full responsibility for any decisions or outcomes arising from your use of this website and agree to release us from any liability in connection with your use of, or reliance upon, the content or products found herein.