
|
Maruha Nichiro Corporation (1333.T) Avaliação DCF |
Totalmente Editável: Adapte-Se Às Suas Necessidades No Excel Ou Planilhas
Design Profissional: Modelos Confiáveis E Padrão Da Indústria
Pré-Construídos Para Uso Rápido E Eficiente
Compatível com MAC/PC, totalmente desbloqueado
Não É Necessária Experiência; Fácil De Seguir
Maruha Nichiro Corporation (1333.T) Bundle
Aprimore suas estratégias de investimento com a calculadora DCF (1333T)! Utilize dados financeiros autênticos da Maruha Nichiro Corporation, ajustam as projeções e despesas de crescimento e observe instantaneamente como essas modificações afetam o valor intrínseco de (1333T).
What You Will Receive
- Authentic 1333T Financial Data: Comes pre-loaded with Maruha Nichiro Corporation’s historical and projected figures for accurate analysis.
- Fully Customizable Template: Easily adjust key parameters such as revenue growth, WACC, and EBITDA %.
- Instant Calculations: Watch as Maruha Nichiro's intrinsic value recalibrates automatically based on your modifications.
- Professional Valuation Tool: Crafted for investors, analysts, and consultants aiming for precise DCF outcomes.
- User-Friendly Interface: Straightforward layout and clear guidance suitable for all skill levels.
Key Features
- Pre-Loaded Data: Maruha Nichiro Corporation’s historical financial reports along with pre-filled forecasts.
- Fully Customizable Inputs: Easily modify WACC, tax rates, revenue growth, and EBITDA margins.
- Real-Time Results: Instantly view the intrinsic value of Maruha Nichiro Corporation recalculating as you adjust inputs.
- Clear Visual Displays: Dashboard charts illustrate valuation outcomes and key financial metrics.
- Designed for Precision: A reliable tool tailored for analysts, investors, and finance professionals.
How It Works
- Step 1: Download the prebuilt Excel template featuring Maruha Nichiro Corporation’s (1333T) data.
- Step 2: Navigate through the pre-populated sheets to familiarize yourself with the essential metrics.
- Step 3: Modify forecasts and assumptions in the editable yellow cells (WACC, growth, margins).
- Step 4: Instantly view updated results, including Maruha Nichiro Corporation's (1333T) intrinsic value.
- Step 5: Make well-informed investment decisions or create reports based on the outputs.
Why Choose the Maruha Nichiro Calculator?
- Save Time: Skip the hassle of building a DCF model – it's ready for immediate use.
- Enhance Accuracy: Dependable financial data and formulas minimize valuation errors.
- Fully Customizable: Adjust the model to align with your own assumptions and forecasts.
- Easy to Analyze: Intuitive charts and outputs provide clear insights into the results.
- Trusted by Professionals: Crafted for experts who prioritize precision and user-friendliness.
Who Can Benefit from This Product?
- Finance Students: Master valuation techniques and apply them using real market data for Maruha Nichiro Corporation (1333T).
- Academics: Integrate professional valuation models into your research or educational curriculum focusing on Maruha Nichiro Corporation (1333T).
- Investors: Evaluate your own investment hypotheses and assess valuation metrics related to Maruha Nichiro Corporation (1333T).
- Analysts: Enhance your analytical processes with a customizable DCF model tailored for Maruha Nichiro Corporation (1333T).
- Small Business Owners: Learn how major public firms, like Maruha Nichiro Corporation (1333T), are valued in the market.
Contents of the Template
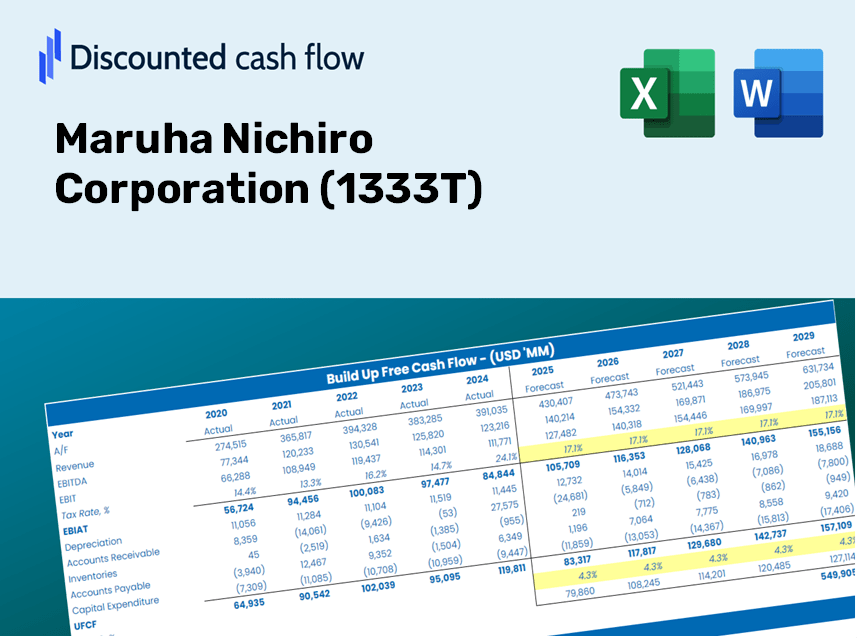
- Preloaded 1333T Data: Historical and projected financial metrics, including revenue, EBIT, and capital expenditures.
- DCF and WACC Models: Professional-grade spreadsheets designed for calculating intrinsic value and Weighted Average Cost of Capital.
- Editable Inputs: Yellow-highlighted cells that allow for adjustments to revenue growth, tax rates, and discount rates.
- Financial Statements: Detailed annual and quarterly financials to facilitate in-depth analysis.
- Key Ratios: Profitability, leverage, and efficiency ratios for assessing company performance.
- Dashboard and Charts: Visual representations of valuation results and fundamental assumptions.
Disclaimer
All information, articles, and product details provided on this website are for general informational and educational purposes only. We do not claim any ownership over, nor do we intend to infringe upon, any trademarks, copyrights, logos, brand names, or other intellectual property mentioned or depicted on this site. Such intellectual property remains the property of its respective owners, and any references here are made solely for identification or informational purposes, without implying any affiliation, endorsement, or partnership.
We make no representations or warranties, express or implied, regarding the accuracy, completeness, or suitability of any content or products presented. Nothing on this website should be construed as legal, tax, investment, financial, medical, or other professional advice. In addition, no part of this site—including articles or product references—constitutes a solicitation, recommendation, endorsement, advertisement, or offer to buy or sell any securities, franchises, or other financial instruments, particularly in jurisdictions where such activity would be unlawful.
All content is of a general nature and may not address the specific circumstances of any individual or entity. It is not a substitute for professional advice or services. Any actions you take based on the information provided here are strictly at your own risk. You accept full responsibility for any decisions or outcomes arising from your use of this website and agree to release us from any liability in connection with your use of, or reliance upon, the content or products found herein.