
|
Banco Industrial e Comercial da China Limited (1398.HK) Avaliação DCF |
Totalmente Editável: Adapte-Se Às Suas Necessidades No Excel Ou Planilhas
Design Profissional: Modelos Confiáveis E Padrão Da Indústria
Pré-Construídos Para Uso Rápido E Eficiente
Compatível com MAC/PC, totalmente desbloqueado
Não É Necessária Experiência; Fácil De Seguir
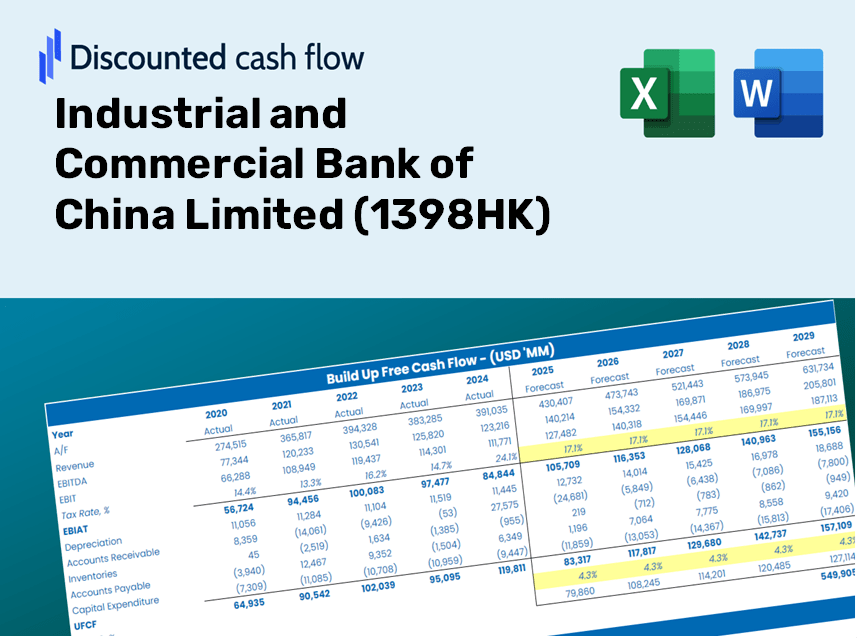
Industrial and Commercial Bank of China Limited (1398.HK) Bundle
Seja você um investidor ou analista, esta calculadora DCF (1398HK) é o seu recurso preferido para uma avaliação precisa. Carregado com dados reais do Banco Industrial e Comercial da China Limited, você pode ajustar as previsões e observar instantaneamente os efeitos.
Discounted Cash Flow (DCF) - (USD MM)
| Year | AY1 2020 |
AY2 2021 |
AY3 2022 |
AY4 2023 |
AY5 2024 |
FY1 2025 |
FY2 2026 |
FY3 2027 |
FY4 2028 |
FY5 2029 |
|---|---|---|---|---|---|---|---|---|---|---|
| Revenue | 658,795.7 | 721,298.5 | 726,662.3 | 719,854.3 | 723,632.5 | 741,395.9 | 759,595.3 | 778,241.6 | 797,345.5 | 816,918.4 |
| Revenue Growth, % | 0 | 9.49 | 0.74363 | -0.93689 | 0.52486 | 2.45 | 2.45 | 2.45 | 2.45 | 2.45 |
| EBITDA | .0 | 499,910.1 | 502,666.0 | .0 | 500,071.2 | 307,808.7 | 315,364.7 | 323,106.1 | 331,037.6 | 339,163.8 |
| EBITDA, % | 0 | 69.31 | 69.17 | 0 | 69.11 | 41.52 | 41.52 | 41.52 | 41.52 | 41.52 |
| Depreciation | -435,282.7 | 34,318.4 | 37,270.4 | 22,380.0 | 37,845.7 | -70,946.7 | -72,688.3 | -74,472.6 | -76,300.7 | -78,173.7 |
| Depreciation, % | -66.07 | 4.76 | 5.13 | 3.11 | 5.23 | -9.57 | -9.57 | -9.57 | -9.57 | -9.57 |
| EBIT | 435,282.7 | 465,591.7 | 465,395.6 | -22,380.0 | 462,225.5 | 378,755.4 | 388,053.0 | 397,578.7 | 407,338.3 | 417,337.5 |
| EBIT, % | 66.07 | 64.55 | 64.05 | -3.11 | 63.88 | 51.09 | 51.09 | 51.09 | 51.09 | 51.09 |
| Total Cash | 5,366,422.3 | 4,592,976.1 | 5,197,989.3 | 5,805,867.9 | 7,639,365.5 | 741,395.9 | 759,595.3 | 778,241.6 | 797,345.5 | 816,918.4 |
| Total Cash, percent | .0 | .0 | .0 | .0 | .0 | .0 | .0 | .0 | .0 | .0 |
| Account Receivables | .0 | .0 | .0 | .0 | .0 | .0 | .0 | .0 | .0 | .0 |
| Account Receivables, % | 0 | 0 | 0 | 0 | 0 | 0 | 0 | 0 | 0 | 0 |
| Inventories | .0 | .0 | .0 | .0 | .0 | .0 | .0 | .0 | .0 | .0 |
| Inventories, % | 0 | 0 | 0 | 0 | 0 | 0 | 0 | 0 | 0 | 0 |
| Accounts Payable | .0 | .0 | .0 | .0 | .0 | .0 | .0 | .0 | .0 | .0 |
| Accounts Payable, % | 0 | 0 | 0 | 0 | 0 | 0 | 0 | 0 | 0 | 0 |
| Capital Expenditure | -33,963.4 | -23,955.7 | -15,026.3 | -15,882.1 | -38,993.0 | -26,896.7 | -27,556.9 | -28,233.4 | -28,926.5 | -29,636.5 |
| Capital Expenditure, % | -5.16 | -3.32 | -2.07 | -2.21 | -5.39 | -3.63 | -3.63 | -3.63 | -3.63 | -3.63 |
| Tax Rate, % | 13.27 | 13.27 | 13.27 | 13.27 | 13.27 | 13.27 | 13.27 | 13.27 | 13.27 | 13.27 |
| EBITAT | 350,674.1 | 381,698.4 | 395,717.7 | -19,305.3 | 400,901.8 | 318,583.4 | 326,403.9 | 334,416.3 | 342,625.4 | 351,036.0 |
| Depreciation | ||||||||||
| Changes in Account Receivables | ||||||||||
| Changes in Inventories | ||||||||||
| Changes in Accounts Payable | ||||||||||
| Capital Expenditure | ||||||||||
| UFCF | -118,572.0 | 392,061.1 | 417,961.9 | -12,807.4 | 399,754.5 | 220,740.1 | 226,158.7 | 231,710.3 | 237,398.2 | 243,225.8 |
| WACC, % | 15.68 | 15.92 | 16.43 | 16.63 | 16.71 | 16.27 | 16.27 | 16.27 | 16.27 | 16.27 |
| PV UFCF | ||||||||||
| SUM PV UFCF | 748,869.6 | |||||||||
| Long Term Growth Rate, % | 2.00 | |||||||||
| Free cash flow (T + 1) | 248,090 | |||||||||
| Terminal Value | 1,738,174 | |||||||||
| Present Terminal Value | 817,896 | |||||||||
| Enterprise Value | 1,566,766 | |||||||||
| Net Debt | -2,357,965 | |||||||||
| Equity Value | 3,924,731 | |||||||||
| Diluted Shares Outstanding, MM | 356,406 | |||||||||
| Equity Value Per Share | 11.01 |
What You Will Receive
- Authentic ICBC Data: Comprehensive financials – from revenue to EBIT – utilizing real and forecasted figures.
- Complete Customization: Modify all essential parameters (yellow cells) such as WACC, growth %, and tax rates.
- Immediate Valuation Adjustments: Automatic recalculations to assess the effects of changes on ICBC’s fair value.
- Adaptable Excel Template: Designed for quick modifications, scenario analysis, and in-depth projections.
- Efficient and Precise: Avoid building models from scratch while ensuring accuracy and flexibility.
Key Features
- Authentic Financial Data: Gain access to reliable pre-loaded historical figures and future forecasts for Industrial and Commercial Bank of China Limited (1398HK).
- Tailorable Forecast Inputs: Modify highlighted cells, including WACC, growth rates, and profit margins, to suit your analysis.
- Automated Calculations: Real-time updates for DCF, Net Present Value (NPV), and cash flow analysis ensure accuracy.
- Interactive Dashboard: Clear and concise charts and summaries to effectively present your valuation findings.
- Suitable for All Skill Levels: A user-friendly framework designed for investors, CFOs, and consultants alike.
How It Functions
- Step 1: Download the Excel spreadsheet.
- Step 2: Examine the pre-filled data for Industrial and Commercial Bank of China Limited (1398HK) (historical and forecasted).
- Step 3: Modify key assumptions (highlighted in yellow) according to your analysis.
- Step 4: Observe the automatic updates for the intrinsic value of Industrial and Commercial Bank of China Limited (1398HK).
- Step 5: Utilize the results for investment choices or reporting purposes.
Why Choose This Calculator for Industrial and Commercial Bank of China Limited (1398HK)?
- User-Friendly Interface: Suitable for both novices and seasoned professionals.
- Customizable Inputs: Easily adjust parameters to tailor your analysis.
- Real-Time Valuation: Instantly observe how changes affect the valuation of Industrial and Commercial Bank of China Limited (1398HK).
- Preloaded Financial Data: Comes equipped with the latest financial metrics for efficient analysis.
- Relied Upon by Experts: Favored by investors and analysts for making well-informed decisions.
Who Can Benefit from This Product?
- Finance Students: Explore valuation methodologies and apply them using real-world data for (1398HK).
- Academics: Integrate industry-standard models into your lectures or research focused on (1398HK).
- Investors: Validate your own hypotheses and evaluate valuation results for Industrial and Commercial Bank of China Limited (1398HK).
- Analysts: Enhance your efficiency with a ready-made, customizable DCF model tailored for (1398HK).
- Small Business Owners: Understand how major corporations like Industrial and Commercial Bank of China Limited (1398HK) are evaluated in the market.
What the Template Contains
- Historical Data: Comprehensive records of Industrial and Commercial Bank of China Limited’s past financial performance and foundational forecasts.
- DCF and Levered DCF Models: In-depth templates designed to assess the intrinsic value of Industrial and Commercial Bank of China Limited (1398HK).
- WACC Sheet: Pre-configured calculations for the Weighted Average Cost of Capital.
- Editable Inputs: Customize essential drivers such as growth rates, EBITDA percentages, and CAPEX projections.
- Quarterly and Annual Statements: A thorough analysis of Industrial and Commercial Bank of China Limited’s financial data.
- Interactive Dashboard: Dynamically visualize valuation outputs and forecasts.
Disclaimer
All information, articles, and product details provided on this website are for general informational and educational purposes only. We do not claim any ownership over, nor do we intend to infringe upon, any trademarks, copyrights, logos, brand names, or other intellectual property mentioned or depicted on this site. Such intellectual property remains the property of its respective owners, and any references here are made solely for identification or informational purposes, without implying any affiliation, endorsement, or partnership.
We make no representations or warranties, express or implied, regarding the accuracy, completeness, or suitability of any content or products presented. Nothing on this website should be construed as legal, tax, investment, financial, medical, or other professional advice. In addition, no part of this site—including articles or product references—constitutes a solicitation, recommendation, endorsement, advertisement, or offer to buy or sell any securities, franchises, or other financial instruments, particularly in jurisdictions where such activity would be unlawful.
All content is of a general nature and may not address the specific circumstances of any individual or entity. It is not a substitute for professional advice or services. Any actions you take based on the information provided here are strictly at your own risk. You accept full responsibility for any decisions or outcomes arising from your use of this website and agree to release us from any liability in connection with your use of, or reliance upon, the content or products found herein.