
|
Yadea Group Holdings Ltd. (1585.HK) Avaliação DCF |
Totalmente Editável: Adapte-Se Às Suas Necessidades No Excel Ou Planilhas
Design Profissional: Modelos Confiáveis E Padrão Da Indústria
Pré-Construídos Para Uso Rápido E Eficiente
Compatível com MAC/PC, totalmente desbloqueado
Não É Necessária Experiência; Fácil De Seguir
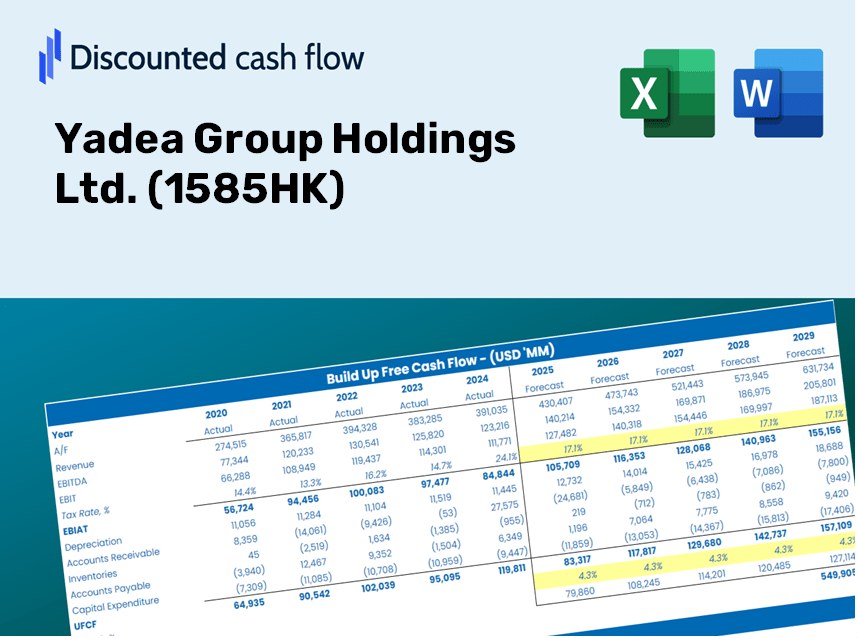
Yadea Group Holdings Ltd. (1585.HK) Bundle
Explore as perspectivas financeiras da Yadea Group Holdings Ltd. (1585HK) com nossa calculadora DCF amigável! Digite suas suposições de crescimento, margens e custos para calcular o valor intrínseco da Yadea Group Holdings Ltd. (1585HK) e refine sua estratégia de investimento.
Discounted Cash Flow (DCF) - (USD MM)
| Year | AY1 2020 |
AY2 2021 |
AY3 2022 |
AY4 2023 |
AY5 2024 |
FY1 2025 |
FY2 2026 |
FY3 2027 |
FY4 2028 |
FY5 2029 |
|---|---|---|---|---|---|---|---|---|---|---|
| Revenue | 21,175.0 | 29,495.3 | 33,970.7 | 38,021.2 | 30,882.9 | 32,274.2 | 33,728.1 | 35,247.6 | 36,835.5 | 38,494.9 |
| Revenue Growth, % | 0 | 39.29 | 15.17 | 11.92 | -18.77 | 4.5 | 4.5 | 4.5 | 4.5 | 4.5 |
| EBITDA | 1,225.0 | 1,564.6 | 2,972.5 | 3,791.6 | 2,274.6 | 2,399.7 | 2,507.9 | 2,620.8 | 2,738.9 | 2,862.3 |
| EBITDA, % | 5.79 | 5.3 | 8.75 | 9.97 | 7.37 | 7.44 | 7.44 | 7.44 | 7.44 | 7.44 |
| Depreciation | 128.7 | 194.5 | 298.3 | 440.2 | 503.5 | 318.4 | 332.8 | 347.8 | 363.4 | 379.8 |
| Depreciation, % | 0.60768 | 0.6594 | 0.87801 | 1.16 | 1.63 | 0.98665 | 0.98665 | 0.98665 | 0.98665 | 0.98665 |
| EBIT | 1,096.3 | 1,370.1 | 2,674.2 | 3,351.4 | 1,771.1 | 2,081.3 | 2,175.1 | 2,273.1 | 2,375.5 | 2,482.5 |
| EBIT, % | 5.18 | 4.65 | 7.87 | 8.81 | 5.74 | 6.45 | 6.45 | 6.45 | 6.45 | 6.45 |
| Total Cash | 8,616.5 | 10,971.5 | 12,043.4 | 12,587.5 | 11,401.1 | 11,835.9 | 12,369.1 | 12,926.4 | 13,508.7 | 14,117.2 |
| Total Cash, percent | .0 | .0 | .0 | .0 | .0 | .0 | .0 | .0 | .0 | .0 |
| Account Receivables | 424.7 | 429.4 | 424.7 | 597.1 | 626.2 | 536.4 | 560.6 | 585.8 | 612.2 | 639.8 |
| Account Receivables, % | 2.01 | 1.46 | 1.25 | 1.57 | 2.03 | 1.66 | 1.66 | 1.66 | 1.66 | 1.66 |
| Inventories | 744.0 | 1,306.2 | 1,594.7 | 1,045.0 | 1,399.3 | 1,285.5 | 1,343.4 | 1,404.0 | 1,467.2 | 1,533.3 |
| Inventories, % | 3.51 | 4.43 | 4.69 | 2.75 | 4.53 | 3.98 | 3.98 | 3.98 | 3.98 | 3.98 |
| Accounts Payable | 11,797.0 | 13,954.0 | 14,867.0 | 14,953.7 | 12,984.2 | 14,727.3 | 15,390.7 | 16,084.1 | 16,808.7 | 17,565.9 |
| Accounts Payable, % | 55.71 | 47.31 | 43.76 | 39.33 | 42.04 | 45.63 | 45.63 | 45.63 | 45.63 | 45.63 |
| Capital Expenditure | -619.0 | -1,044.2 | -708.6 | -1,460.7 | -1,637.1 | -1,142.0 | -1,193.4 | -1,247.2 | -1,303.4 | -1,362.1 |
| Capital Expenditure, % | -2.92 | -3.54 | -2.09 | -3.84 | -5.3 | -3.54 | -3.54 | -3.54 | -3.54 | -3.54 |
| Tax Rate, % | 19.64 | 19.64 | 19.64 | 19.64 | 19.64 | 19.64 | 19.64 | 19.64 | 19.64 | 19.64 |
| EBITAT | 884.4 | 1,245.1 | 2,209.8 | 2,929.9 | 1,423.2 | 1,756.5 | 1,835.6 | 1,918.3 | 2,004.7 | 2,095.0 |
| Depreciation | ||||||||||
| Changes in Account Receivables | ||||||||||
| Changes in Inventories | ||||||||||
| Changes in Accounts Payable | ||||||||||
| Capital Expenditure | ||||||||||
| UFCF | 11,022.4 | 1,985.5 | 2,428.6 | 2,373.5 | -2,063.4 | 2,879.6 | 1,556.3 | 1,626.4 | 1,699.7 | 1,776.3 |
| WACC, % | 8.34 | 8.36 | 8.35 | 8.35 | 8.34 | 8.35 | 8.35 | 8.35 | 8.35 | 8.35 |
| PV UFCF | ||||||||||
| SUM PV UFCF | 7,684.9 | |||||||||
| Long Term Growth Rate, % | 1.00 | |||||||||
| Free cash flow (T + 1) | 1,794 | |||||||||
| Terminal Value | 24,411 | |||||||||
| Present Terminal Value | 16,348 | |||||||||
| Enterprise Value | 24,032 | |||||||||
| Net Debt | -6,868 | |||||||||
| Equity Value | 30,900 | |||||||||
| Diluted Shares Outstanding, MM | 3,019 | |||||||||
| Equity Value Per Share | 10.23 |
Benefits of Using Our Tool
- Authentic Yadea Financial Data: Pre-loaded with Yadea Group Holdings Ltd.'s historical and projected figures for accurate analysis.
- Customizable Template: Effortlessly adjust essential inputs such as revenue growth, WACC, and EBITDA percentages.
- Instant Calculations: Instantly view updates to Yadea’s intrinsic value as you modify your inputs.
- Expert Valuation Solution: Tailored for investors, analysts, and consultants aiming for precise DCF results.
- Accessible Design: Intuitive layout and straightforward guidance suitable for all skill levels.
Key Features
- Comprehensive Historical Data: Yadea Group Holdings Ltd.'s financial statements and projected forecasts are readily available.
- Customizable Parameters: Modify WACC, tax rates, revenue growth projections, and EBITDA margins as needed.
- Real-Time Analysis: Observe the recalibration of Yadea's intrinsic value instantly.
- Intuitive Visualizations: Dashboard charts present valuation outcomes and important financial metrics clearly.
- Designed for Precision: A professional-grade tool tailored for analysts, investors, and finance professionals.
How It Functions
- 1. Access the Template: Download and open the Excel file containing Yadea Group Holdings Ltd.’s preloaded data.
- 2. Adjust Assumptions: Modify essential inputs such as growth rates, WACC, and capital expenditures.
- 3. Instant Result Analysis: The DCF model automatically computes intrinsic value and NPV.
- 4. Explore Scenarios: Evaluate various forecasts to examine different valuation results.
- 5. Present with Assurance: Share professional valuation insights to enhance your decision-making.
Why Opt for This Calculator?
- Precise Insights: Utilize authentic financial data from Yadea Group Holdings Ltd. to achieve trustworthy valuation outcomes.
- Adaptable: Tailor essential metrics such as growth rates, WACC, and tax rates to align with your forecasts.
- Efficient: Integrated calculations save you the hassle of starting from square one.
- Professional Quality: Crafted for investors, analysts, and consultants alike.
- Easy to Use: Friendly interface and clear, step-by-step guidance make it accessible for everyone.
Who Can Benefit from This Product?
- Professional Investors: Create comprehensive and dependable valuation models for portfolio assessments of Yadea Group Holdings Ltd. (1585HK).
- Corporate Finance Teams: Examine valuation scenarios to inform strategic decisions within their organizations.
- Consultants and Advisors: Offer clients precise valuation insights specifically for Yadea Group Holdings Ltd. (1585HK).
- Students and Educators: Utilize real-world data to enhance learning and practice in financial modeling.
- Tech Enthusiasts: Gain insights into how companies like Yadea Group Holdings Ltd. (1585HK) are valued in the marketplace.
Contents of the Template
- Preloaded Yadea Data: Historical and projected financial data, including revenue, EBIT, and capital expenditures.
- DCF and WACC Models: Professional-grade spreadsheets for calculating intrinsic value and Weighted Average Cost of Capital.
- Editable Inputs: Yellow-highlighted cells for customizing revenue growth, tax rates, and discount rates.
- Financial Statements: Detailed annual and quarterly financials for in-depth analysis.
- Key Ratios: Profitability, leverage, and efficiency ratios to assess performance.
- Dashboard and Charts: Visual summaries of valuation results and underlying assumptions.
Disclaimer
All information, articles, and product details provided on this website are for general informational and educational purposes only. We do not claim any ownership over, nor do we intend to infringe upon, any trademarks, copyrights, logos, brand names, or other intellectual property mentioned or depicted on this site. Such intellectual property remains the property of its respective owners, and any references here are made solely for identification or informational purposes, without implying any affiliation, endorsement, or partnership.
We make no representations or warranties, express or implied, regarding the accuracy, completeness, or suitability of any content or products presented. Nothing on this website should be construed as legal, tax, investment, financial, medical, or other professional advice. In addition, no part of this site—including articles or product references—constitutes a solicitation, recommendation, endorsement, advertisement, or offer to buy or sell any securities, franchises, or other financial instruments, particularly in jurisdictions where such activity would be unlawful.
All content is of a general nature and may not address the specific circumstances of any individual or entity. It is not a substitute for professional advice or services. Any actions you take based on the information provided here are strictly at your own risk. You accept full responsibility for any decisions or outcomes arising from your use of this website and agree to release us from any liability in connection with your use of, or reliance upon, the content or products found herein.