
|
Avaliação DCF da Comsys Holdings Corporation (1721.T) |
Totalmente Editável: Adapte-Se Às Suas Necessidades No Excel Ou Planilhas
Design Profissional: Modelos Confiáveis E Padrão Da Indústria
Pré-Construídos Para Uso Rápido E Eficiente
Compatível com MAC/PC, totalmente desbloqueado
Não É Necessária Experiência; Fácil De Seguir
COMSYS Holdings Corporation (1721.T) Bundle
Simplifique a avaliação da Comsys Holdings Corporation (1721T) com esta calculadora DCF personalizável! Com o Real Comsys Holdings Corporation (1721T) financeiras e insumos de previsão ajustável, você pode testar cenários e descobrir o valor justo da Comsys Holdings Corporation (1721T) em minutos.
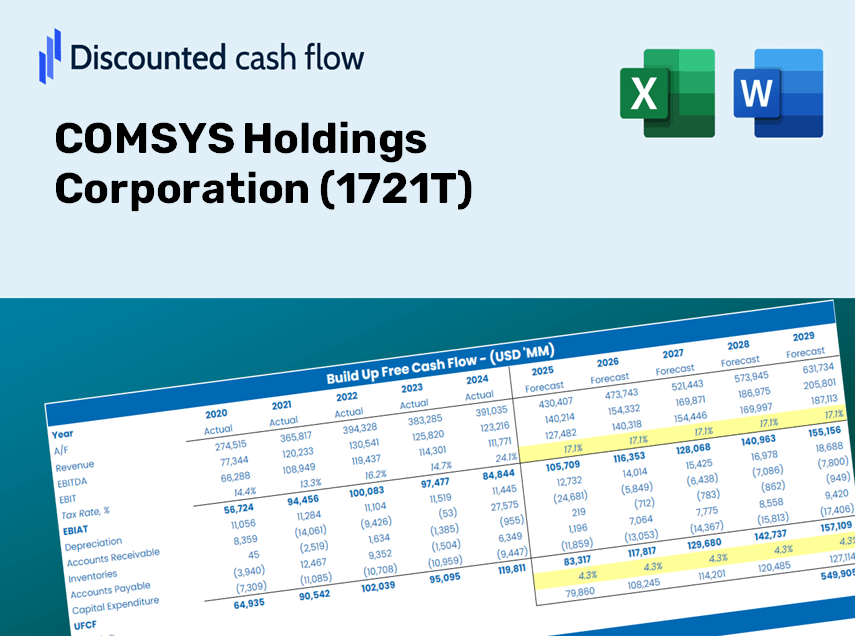
Discounted Cash Flow (DCF) - (USD MM)
| Year | AY1 2020 |
AY2 2021 |
AY3 2022 |
AY4 2023 |
AY5 2024 |
FY1 2025 |
FY2 2026 |
FY3 2027 |
FY4 2028 |
FY5 2029 |
|---|---|---|---|---|---|---|---|---|---|---|
| Revenue | 563,252.0 | 589,028.0 | 563,295.0 | 571,186.0 | 614,631.0 | 628,789.8 | 643,274.8 | 658,093.5 | 673,253.6 | 688,762.9 |
| Revenue Growth, % | 0 | 4.58 | -4.37 | 1.4 | 7.61 | 2.3 | 2.3 | 2.3 | 2.3 | 2.3 |
| EBITDA | 53,708.0 | 54,486.0 | 42,036.0 | 52,715.0 | 57,042.0 | 56,286.4 | 57,583.1 | 58,909.6 | 60,266.6 | 61,654.9 |
| EBITDA, % | 9.54 | 9.25 | 7.46 | 9.23 | 9.28 | 8.95 | 8.95 | 8.95 | 8.95 | 8.95 |
| Depreciation | 10,411.0 | 10,971.0 | 11,469.0 | 11,710.0 | 11,844.0 | 12,228.9 | 12,510.6 | 12,798.8 | 13,093.6 | 13,395.2 |
| Depreciation, % | 1.85 | 1.86 | 2.04 | 2.05 | 1.93 | 1.94 | 1.94 | 1.94 | 1.94 | 1.94 |
| EBIT | 43,297.0 | 43,515.0 | 30,567.0 | 41,005.0 | 45,198.0 | 44,057.6 | 45,072.5 | 46,110.8 | 47,173.0 | 48,259.7 |
| EBIT, % | 7.69 | 7.39 | 5.43 | 7.18 | 7.35 | 7.01 | 7.01 | 7.01 | 7.01 | 7.01 |
| Total Cash | 33,259.0 | 35,107.0 | 41,367.0 | 52,500.0 | 38,788.0 | 43,651.7 | 44,657.3 | 45,686.0 | 46,738.5 | 47,815.2 |
| Total Cash, percent | .0 | .0 | .0 | .0 | .0 | .0 | .0 | .0 | .0 | .0 |
| Account Receivables | 199,755.0 | 227,918.0 | 193,263.0 | 187,623.0 | 220,407.0 | 222,812.8 | 227,945.6 | 233,196.6 | 238,568.6 | 244,064.4 |
| Account Receivables, % | 35.46 | 38.69 | 34.31 | 32.85 | 35.86 | 35.44 | 35.44 | 35.44 | 35.44 | 35.44 |
| Inventories | 34,439.0 | 51,570.0 | 57,589.0 | 49,191.0 | 54,441.0 | 53,525.9 | 54,758.9 | 56,020.3 | 57,310.8 | 58,631.1 |
| Inventories, % | 6.11 | 8.76 | 10.22 | 8.61 | 8.86 | 8.51 | 8.51 | 8.51 | 8.51 | 8.51 |
| Accounts Payable | 87,812.0 | 87,514.0 | 82,842.0 | 77,250.0 | 88,475.0 | 91,895.8 | 94,012.7 | 96,178.4 | 98,394.0 | 100,660.7 |
| Accounts Payable, % | 15.59 | 14.86 | 14.71 | 13.52 | 14.39 | 14.61 | 14.61 | 14.61 | 14.61 | 14.61 |
| Capital Expenditure | -12,151.0 | -10,820.0 | -8,682.0 | -18,727.0 | -9,517.0 | -13,031.7 | -13,331.9 | -13,639.0 | -13,953.2 | -14,274.7 |
| Capital Expenditure, % | -2.16 | -1.84 | -1.54 | -3.28 | -1.55 | -2.07 | -2.07 | -2.07 | -2.07 | -2.07 |
| Tax Rate, % | 33.41 | 33.41 | 33.41 | 33.41 | 33.41 | 33.41 | 33.41 | 33.41 | 33.41 | 33.41 |
| EBITAT | 29,391.4 | 29,228.8 | 19,354.5 | 27,467.7 | 30,097.6 | 29,249.6 | 29,923.4 | 30,612.8 | 31,318.0 | 32,039.4 |
| Depreciation | ||||||||||
| Changes in Account Receivables | ||||||||||
| Changes in Inventories | ||||||||||
| Changes in Accounts Payable | ||||||||||
| Capital Expenditure | ||||||||||
| UFCF | -118,730.6 | -16,212.2 | 46,105.5 | 28,896.7 | 5,615.6 | 30,376.9 | 24,853.2 | 25,425.7 | 26,011.5 | 26,610.7 |
| WACC, % | 4.98 | 4.98 | 4.98 | 4.98 | 4.98 | 4.98 | 4.98 | 4.98 | 4.98 | 4.98 |
| PV UFCF | ||||||||||
| SUM PV UFCF | 115,752.5 | |||||||||
| Long Term Growth Rate, % | 2.00 | |||||||||
| Free cash flow (T + 1) | 27,143 | |||||||||
| Terminal Value | 911,144 | |||||||||
| Present Terminal Value | 714,620 | |||||||||
| Enterprise Value | 830,372 | |||||||||
| Net Debt | -35,779 | |||||||||
| Equity Value | 866,151 | |||||||||
| Diluted Shares Outstanding, MM | 119 | |||||||||
| Equity Value Per Share | 7,286.07 |
Benefits You Will Receive
- Accurate COMSYS Financial Data: Pre-loaded with historical and forecasted data for in-depth analysis of COMSYS Holdings Corporation (1721T).
- Customizable Template: Easily adjust essential inputs such as revenue growth, WACC, and EBITDA percentages.
- Instant Calculations: Watch the intrinsic value of COMSYS update in real-time based on your modifications.
- Professional Valuation Tool: Tailored for investors, analysts, and consultants aiming for precise DCF outcomes.
- Intuitive Interface: User-friendly layout with straightforward instructions suitable for all levels of expertise.
Key Features
- Pre-Loaded Data: Comprehensive historical financial statements and pre-filled forecasts for COMSYS Holdings Corporation (1721T).
- Fully Adjustable Inputs: Customize WACC, tax rates, revenue growth, and EBITDA margins to fit your analysis.
- Instant Results: Watch the intrinsic value of COMSYS Holdings Corporation (1721T) recalibrate in real time.
- Clear Visual Outputs: Intuitive dashboard charts showcase valuation results and essential metrics.
- Built for Accuracy: A reliable tool designed for analysts, investors, and finance professionals.
How It Works
- 1. Access the Template: Download and open the Excel file featuring COMSYS Holdings Corporation’s (1721T) preloaded data.
- 2. Modify Assumptions: Adjust crucial inputs such as growth rates, WACC, and capital expenditures.
- 3. View Results in Real-Time: The DCF model will automatically compute the intrinsic value and NPV.
- 4. Explore Scenarios: Analyze various forecasts to evaluate different valuation scenarios.
- 5. Present with Assurance: Deliver professional valuation insights to strengthen your decision-making process.
Why Choose the COMSYS Holdings Corporation ([1721T]) Calculator?
- Precision: Tapping into actual COMSYS financial data guarantees pinpoint accuracy.
- Versatility: Built to allow users to easily experiment with and adjust inputs.
- Efficiency: Eliminate the tedious process of constructing a DCF model from the ground up.
- Expert-Level: Crafted with the meticulousness and user-friendliness expected by CFOs.
- Intuitive: Simple to navigate, even for individuals lacking advanced financial modeling skills.
Who Can Benefit from COMSYS Holdings Corporation (1721T)?
- Investors: Make informed choices with our advanced valuation tools designed for serious investment analysis.
- Financial Analysts: Streamline your workflow with a customizable DCF model that's ready to go.
- Consultants: Effortlessly tailor the template for engaging client presentations or detailed reports.
- Finance Enthusiasts: Enhance your knowledge of valuation strategies through practical, real-world case studies.
- Educators and Students: Leverage this resource as an effective learning aid in finance-related academic programs.
Contents of the Template
- Preloaded COMSYS Data: Historical and projected financial information, including revenue, EBIT, and capital expenditures.
- DCF and WACC Models: Professional-grade templates for calculating intrinsic value and Weighted Average Cost of Capital.
- Editable Inputs: Yellow-highlighted cells for modifying revenue growth, tax rates, and discount rates.
- Financial Statements: Detailed annual and quarterly financial reports for in-depth analysis.
- Key Ratios: Metrics on profitability, leverage, and efficiency for performance evaluation.
- Dashboard and Charts: Visual representations of valuation results and underlying assumptions.
Disclaimer
All information, articles, and product details provided on this website are for general informational and educational purposes only. We do not claim any ownership over, nor do we intend to infringe upon, any trademarks, copyrights, logos, brand names, or other intellectual property mentioned or depicted on this site. Such intellectual property remains the property of its respective owners, and any references here are made solely for identification or informational purposes, without implying any affiliation, endorsement, or partnership.
We make no representations or warranties, express or implied, regarding the accuracy, completeness, or suitability of any content or products presented. Nothing on this website should be construed as legal, tax, investment, financial, medical, or other professional advice. In addition, no part of this site—including articles or product references—constitutes a solicitation, recommendation, endorsement, advertisement, or offer to buy or sell any securities, franchises, or other financial instruments, particularly in jurisdictions where such activity would be unlawful.
All content is of a general nature and may not address the specific circumstances of any individual or entity. It is not a substitute for professional advice or services. Any actions you take based on the information provided here are strictly at your own risk. You accept full responsibility for any decisions or outcomes arising from your use of this website and agree to release us from any liability in connection with your use of, or reliance upon, the content or products found herein.