
|
Token Corporation (1766.T) Avaliação DCF |
Totalmente Editável: Adapte-Se Às Suas Necessidades No Excel Ou Planilhas
Design Profissional: Modelos Confiáveis E Padrão Da Indústria
Pré-Construídos Para Uso Rápido E Eficiente
Compatível com MAC/PC, totalmente desbloqueado
Não É Necessária Experiência; Fácil De Seguir
Token Corporation (1766.T) Bundle
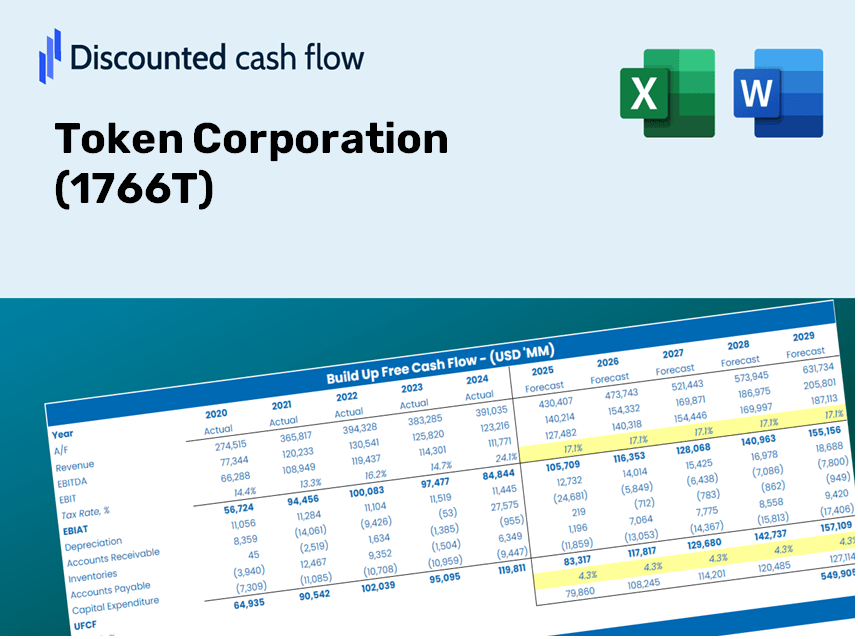
Aprimore suas estratégias de investimento com a calculadora DCF da Token Corporation (1766T)! Explore dados financeiros autênticos, ajuste as projeções e despesas de crescimento e observe instantaneamente como essas modificações influenciam o valor intrínseco da corporação de token.
Discounted Cash Flow (DCF) - (USD MM)
| Year | AY1 2020 |
AY2 2021 |
AY3 2022 |
AY4 2023 |
AY5 2024 |
FY1 2025 |
FY2 2026 |
FY3 2027 |
FY4 2028 |
FY5 2029 |
|---|---|---|---|---|---|---|---|---|---|---|
| Revenue | 309,809.0 | 311,586.0 | 316,849.0 | 340,835.0 | 366,639.0 | 382,591.2 | 399,237.4 | 416,607.9 | 434,734.1 | 453,649.0 |
| Revenue Growth, % | 0 | 0.57358 | 1.69 | 7.57 | 7.57 | 4.35 | 4.35 | 4.35 | 4.35 | 4.35 |
| EBITDA | 18,041.0 | 17,272.0 | 11,960.0 | 15,050.0 | 24,407.0 | 20,058.3 | 20,931.0 | 21,841.7 | 22,792.0 | 23,783.7 |
| EBITDA, % | 5.82 | 5.54 | 3.77 | 4.42 | 6.66 | 5.24 | 5.24 | 5.24 | 5.24 | 5.24 |
| Depreciation | 2,479.0 | 2,233.0 | 2,221.0 | 2,012.0 | 2,146.0 | 2,596.6 | 2,709.6 | 2,827.5 | 2,950.5 | 3,078.8 |
| Depreciation, % | 0.80017 | 0.71666 | 0.70096 | 0.59031 | 0.58532 | 0.67868 | 0.67868 | 0.67868 | 0.67868 | 0.67868 |
| EBIT | 15,562.0 | 15,039.0 | 9,739.0 | 13,038.0 | 22,261.0 | 17,461.7 | 18,221.5 | 19,014.3 | 19,841.6 | 20,704.9 |
| EBIT, % | 5.02 | 4.83 | 3.07 | 3.83 | 6.07 | 4.56 | 4.56 | 4.56 | 4.56 | 4.56 |
| Total Cash | 124,845.0 | 123,527.0 | 118,157.0 | 120,954.0 | 136,576.0 | 145,362.9 | 151,687.6 | 158,287.3 | 165,174.3 | 172,360.9 |
| Total Cash, percent | .0 | .0 | .0 | .0 | .0 | .0 | .0 | .0 | .0 | .0 |
| Account Receivables | 4,929.0 | 6,227.0 | 6,971.0 | 6,989.0 | 7,280.0 | 7,518.5 | 7,845.6 | 8,186.9 | 8,543.2 | 8,914.9 |
| Account Receivables, % | 1.59 | 2 | 2.2 | 2.05 | 1.99 | 1.97 | 1.97 | 1.97 | 1.97 | 1.97 |
| Inventories | 2,991.0 | 3,418.0 | 4,149.0 | 3,733.0 | 4,120.0 | 4,278.0 | 4,464.1 | 4,658.4 | 4,861.1 | 5,072.6 |
| Inventories, % | 0.96543 | 1.1 | 1.31 | 1.1 | 1.12 | 1.12 | 1.12 | 1.12 | 1.12 | 1.12 |
| Accounts Payable | 17,983.0 | 9,477.0 | 10,004.0 | 10,576.0 | 11,137.0 | 13,883.5 | 14,487.5 | 15,117.8 | 15,775.6 | 16,462.0 |
| Accounts Payable, % | 5.8 | 3.04 | 3.16 | 3.1 | 3.04 | 3.63 | 3.63 | 3.63 | 3.63 | 3.63 |
| Capital Expenditure | -940.0 | -786.0 | -819.0 | -871.0 | -1,607.0 | -1,153.9 | -1,204.1 | -1,256.5 | -1,311.2 | -1,368.2 |
| Capital Expenditure, % | -0.30341 | -0.25226 | -0.25848 | -0.25555 | -0.43831 | -0.3016 | -0.3016 | -0.3016 | -0.3016 | -0.3016 |
| Tax Rate, % | 30.73 | 30.73 | 30.73 | 30.73 | 30.73 | 30.73 | 30.73 | 30.73 | 30.73 | 30.73 |
| EBITAT | 10,270.1 | 10,071.4 | 5,969.7 | 8,772.8 | 15,421.2 | 11,553.4 | 12,056.1 | 12,580.6 | 13,128.0 | 13,699.2 |
| Depreciation | ||||||||||
| Changes in Account Receivables | ||||||||||
| Changes in Inventories | ||||||||||
| Changes in Accounts Payable | ||||||||||
| Capital Expenditure | ||||||||||
| UFCF | 21,872.1 | 1,287.4 | 6,423.7 | 10,883.8 | 15,843.2 | 15,346.1 | 13,652.3 | 14,246.3 | 14,866.2 | 15,513.0 |
| WACC, % | 5.53 | 5.53 | 5.53 | 5.53 | 5.53 | 5.53 | 5.53 | 5.53 | 5.53 | 5.53 |
| PV UFCF | ||||||||||
| SUM PV UFCF | 62,754.4 | |||||||||
| Long Term Growth Rate, % | 0.50 | |||||||||
| Free cash flow (T + 1) | 15,591 | |||||||||
| Terminal Value | 309,677 | |||||||||
| Present Terminal Value | 236,558 | |||||||||
| Enterprise Value | 299,312 | |||||||||
| Net Debt | -136,576 | |||||||||
| Equity Value | 435,888 | |||||||||
| Diluted Shares Outstanding, MM | 13 | |||||||||
| Equity Value Per Share | 32,422.52 |
What You Will Receive
- Genuine Token Data: Preloaded financials – covering everything from revenue to EBIT – based on actual and forecasted figures.
- Comprehensive Customization: Modify all key parameters (yellow cells) such as WACC, growth %, and tax rates.
- Immediate Valuation Adjustments: Automatic recalculations to assess the impact of changes on Token Corporation’s fair value.
- Flexible Excel Template: Designed for quick modifications, scenario analysis, and in-depth projections.
- Efficient and Precise: Bypass the need to build models from the ground up while ensuring accuracy and adaptability.
Key Features
- Customizable Forecast Inputs: Adjust essential factors such as revenue growth, EBITDA percentage, and capital expenditure.
- Instant DCF Valuation: Automatically computes intrinsic value, NPV, and various outputs in real-time.
- High-Precision Accuracy: Leverages Token Corporation’s (1766T) actual financial data for reliable valuation results.
- Simplified Scenario Analysis: Effortlessly test various assumptions and assess different outcomes.
- Efficiency Booster: Avoid the hassle of creating intricate valuation models from the ground up.
How It Works
- 1. Access the Template: Download and open the Excel file containing Token Corporation’s preloaded data.
- 2. Modify Assumptions: Adjust key inputs such as growth rates, WACC, and capital expenditures.
- 3. View Results Instantly: The DCF model automatically calculates the intrinsic value and NPV in real-time.
- 4. Explore Scenarios: Evaluate various forecasts to analyze different valuation scenarios.
- 5. Present with Assurance: Share professional valuation insights to reinforce your decision-making.
Why Choose the Token Corporation (1766T) Calculator?
- All-in-One Solution: Combines DCF, WACC, and financial ratio analyses into a single tool.
- Flexible Customization: Modify the yellow-highlighted cells to explore different financial scenarios.
- In-Depth Analysis: Automatically calculates the intrinsic value and Net Present Value for Token Corporation (1766T).
- Data-Driven: Comes with historical and projected data for precise baseline calculations.
- Designed for Professionals: Perfect for financial analysts, investors, and business consultants.
Who Can Benefit from Token Corporation (1766T)?
- Investors: Evaluate Token Corporation’s valuation prior to making stock transactions.
- CFOs and Financial Analysts: Enhance valuation methodologies and validate forecasts.
- Startup Founders: Discover how established firms like Token Corporation are valued in the market.
- Consultants: Create comprehensive valuation reports for your clients based on Token Corporation.
- Students and Educators: Apply real-world data from Token Corporation to practice and teach valuation strategies.
Contents of the Template
- Pre-Populated DCF Model: Token Corporation’s financial data is preloaded for instant access.
- WACC Calculator: Comprehensive calculations for the Weighted Average Cost of Capital.
- Financial Ratios: Analyze Token Corporation’s profitability, leverage, and operational efficiency.
- Customizable Inputs: Adjust assumptions like growth rates, profit margins, and CAPEX to suit your analysis.
- Financial Statements: Access annual and quarterly reports for thorough financial examination.
- Interactive Dashboard: Effortlessly visualize essential valuation metrics and outcomes.
Disclaimer
All information, articles, and product details provided on this website are for general informational and educational purposes only. We do not claim any ownership over, nor do we intend to infringe upon, any trademarks, copyrights, logos, brand names, or other intellectual property mentioned or depicted on this site. Such intellectual property remains the property of its respective owners, and any references here are made solely for identification or informational purposes, without implying any affiliation, endorsement, or partnership.
We make no representations or warranties, express or implied, regarding the accuracy, completeness, or suitability of any content or products presented. Nothing on this website should be construed as legal, tax, investment, financial, medical, or other professional advice. In addition, no part of this site—including articles or product references—constitutes a solicitation, recommendation, endorsement, advertisement, or offer to buy or sell any securities, franchises, or other financial instruments, particularly in jurisdictions where such activity would be unlawful.
All content is of a general nature and may not address the specific circumstances of any individual or entity. It is not a substitute for professional advice or services. Any actions you take based on the information provided here are strictly at your own risk. You accept full responsibility for any decisions or outcomes arising from your use of this website and agree to release us from any liability in connection with your use of, or reliance upon, the content or products found herein.