
|
YTL Corporation Berhad (1773.T) Avaliação DCF |
Totalmente Editável: Adapte-Se Às Suas Necessidades No Excel Ou Planilhas
Design Profissional: Modelos Confiáveis E Padrão Da Indústria
Pré-Construídos Para Uso Rápido E Eficiente
Compatível com MAC/PC, totalmente desbloqueado
Não É Necessária Experiência; Fácil De Seguir
YTL Corporation Berhad (1773.T) Bundle
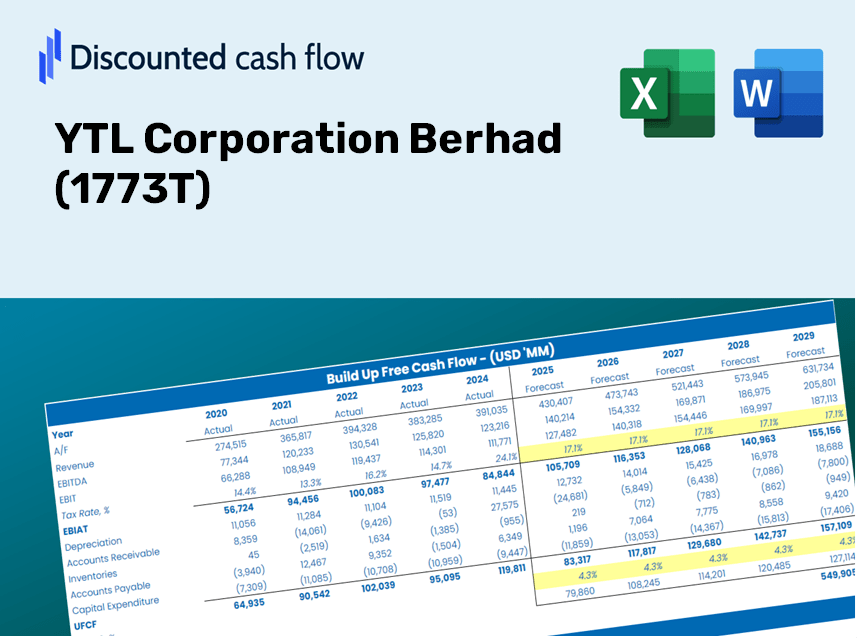
Projetado para precisão, a nossa calculadora DCF (1773T) capacita você a avaliar a avaliação da YTL Corporation Berhad usando dados financeiros atualizados e oferece flexibilidade completa para modificar parâmetros essenciais para projeções aprimoradas.
Discounted Cash Flow (DCF) - (USD MM)
| Year | AY1 2021 |
AY2 2022 |
AY3 2023 |
AY4 2024 |
AY5 2025 |
FY1 2026 |
FY2 2027 |
FY3 2028 |
FY4 2029 |
FY5 2030 |
|---|---|---|---|---|---|---|---|---|---|---|
| Revenue | 613,732.0 | 861,460.7 | 1,052,455.0 | 1,083,534.9 | 1,095,174.3 | 1,277,418.4 | 1,489,989.1 | 1,737,932.9 | 2,027,136.2 | 2,364,464.8 |
| Revenue Growth, % | 0 | 40.36 | 22.17 | 2.95 | 1.07 | 16.64 | 16.64 | 16.64 | 16.64 | 16.64 |
| EBITDA | 145,377.1 | 187,233.6 | 246,511.3 | 333,304.1 | 333,530.8 | 332,281.4 | 387,575.2 | 452,070.2 | 527,297.6 | 615,043.3 |
| EBITDA, % | 23.69 | 21.73 | 23.42 | 30.76 | 30.45 | 26.01 | 26.01 | 26.01 | 26.01 | 26.01 |
| Depreciation | 67,404.7 | 66,288.9 | 67,509.8 | 68,503.4 | 87,371.6 | 100,640.8 | 117,388.1 | 136,922.3 | 159,707.0 | 186,283.3 |
| Depreciation, % | 10.98 | 7.69 | 6.41 | 6.32 | 7.98 | 7.88 | 7.88 | 7.88 | 7.88 | 7.88 |
| EBIT | 77,972.5 | 120,944.7 | 179,001.5 | 264,800.7 | 246,159.2 | 231,640.5 | 270,187.0 | 315,147.9 | 367,590.5 | 428,760.0 |
| EBIT, % | 12.7 | 14.04 | 17.01 | 24.44 | 22.48 | 18.13 | 18.13 | 18.13 | 18.13 | 18.13 |
| Total Cash | 573,990.8 | 458,391.1 | 583,228.3 | 584,951.5 | 696,984.5 | 816,981.8 | 952,932.9 | 1,111,507.1 | 1,296,469.0 | 1,512,209.8 |
| Total Cash, percent | .0 | .0 | .0 | .0 | .0 | .0 | .0 | .0 | .0 | .0 |
| Account Receivables | 130,617.1 | 163,057.7 | 203,369.0 | 235,058.7 | 267,635.6 | 269,957.3 | 314,880.0 | 367,278.0 | 428,395.5 | 499,683.2 |
| Account Receivables, % | 21.28 | 18.93 | 19.32 | 21.69 | 24.44 | 21.13 | 21.13 | 21.13 | 21.13 | 21.13 |
| Inventories | 48,655.9 | 55,196.7 | 57,071.5 | 70,849.9 | 67,738.2 | 82,985.8 | 96,795.1 | 112,902.5 | 131,690.2 | 153,604.3 |
| Inventories, % | 7.93 | 6.41 | 5.42 | 6.54 | 6.19 | 6.5 | 6.5 | 6.5 | 6.5 | 6.5 |
| Accounts Payable | 67,251.5 | 81,254.0 | 106,657.1 | 111,714.3 | 298,588.3 | 173,979.8 | 202,931.2 | 236,700.2 | 276,088.7 | 322,031.6 |
| Accounts Payable, % | 10.96 | 9.43 | 10.13 | 10.31 | 27.26 | 13.62 | 13.62 | 13.62 | 13.62 | 13.62 |
| Capital Expenditure | -70,140.4 | -71,265.5 | -76,759.4 | -136,225.1 | -236,103.6 | -156,165.3 | -182,152.2 | -212,463.5 | -247,818.8 | -289,057.4 |
| Capital Expenditure, % | -11.43 | -8.27 | -7.29 | -12.57 | -21.56 | -12.23 | -12.23 | -12.23 | -12.23 | -12.23 |
| Tax Rate, % | 58.95 | 58.95 | 58.95 | 58.95 | 58.95 | 58.95 | 58.95 | 58.95 | 58.95 | 58.95 |
| EBITAT | -45,375.0 | 46,234.0 | 71,866.5 | 117,281.2 | 101,044.6 | 75,845.9 | 88,467.2 | 103,188.7 | 120,360.0 | 140,388.6 |
| Depreciation | ||||||||||
| Changes in Account Receivables | ||||||||||
| Changes in Inventories | ||||||||||
| Changes in Accounts Payable | ||||||||||
| Capital Expenditure | ||||||||||
| UFCF | -160,132.2 | 16,278.4 | 45,833.8 | 9,148.6 | 109,721.4 | -121,856.3 | -6,077.5 | -7,088.9 | -8,268.5 | -9,644.4 |
| WACC, % | 1.62 | 2.68 | 2.74 | 2.85 | 2.76 | 2.53 | 2.53 | 2.53 | 2.53 | 2.53 |
| PV UFCF | ||||||||||
| SUM PV UFCF | -147,200.6 | |||||||||
| Long Term Growth Rate, % | 2.00 | |||||||||
| Free cash flow (T + 1) | -9,837 | |||||||||
| Terminal Value | -1,854,751 | |||||||||
| Present Terminal Value | -1,636,902 | |||||||||
| Enterprise Value | -1,784,102 | |||||||||
| Net Debt | 1,835,176 | |||||||||
| Equity Value | -3,619,279 | |||||||||
| Diluted Shares Outstanding, MM | 11,982 | |||||||||
| Equity Value Per Share | -302.07 |
What You Will Receive
- Authentic YTL Financial Data: Pre-filled with YTL Corporation Berhad’s historical and projected data for accurate analysis.
- Completely Customizable Template: Easily adjust key inputs such as revenue growth, WACC, and EBITDA %.
- Real-Time Calculations: Observe YTL’s intrinsic value update instantly as you modify your inputs.
- Professional Valuation Tool: Tailored for investors, analysts, and consultants aiming for precise DCF results.
- Intuitive Design: User-friendly layout and straightforward instructions suitable for all skill levels.
Key Features
- Comprehensive DCF Calculator: Provides detailed unlevered and levered DCF valuation models tailored for YTL Corporation Berhad (1773T).
- WACC Calculation Tool: Comes with a pre-configured Weighted Average Cost of Capital sheet featuring customizable parameters.
- Adjustable Forecast Assumptions: Easily modify growth rates, capital expenses, and discount rates to suit your analysis.
- Integrated Financial Ratios: Evaluate profitability, leverage, and efficiency ratios specifically for YTL Corporation Berhad (1773T).
- Interactive Dashboard and Visualization: Visual aids present key valuation metrics for streamlined analysis.
How It Works
- Step 1: Download the prebuilt Excel template featuring YTL Corporation Berhad's (1773T) data.
- Step 2: Review the pre-filled sheets to familiarize yourself with the essential metrics.
- Step 3: Modify forecasts and assumptions in the editable yellow cells (WACC, growth, margins).
- Step 4: Instantly see recalculated results, including YTL Corporation Berhad's (1773T) intrinsic value.
- Step 5: Make well-informed investment choices or create reports based on the outputs.
Why Opt for This Calculator?
- Reliable Data: Accurate financials from YTL Corporation Berhad (1773T) ensure trustworthy valuation outcomes.
- Customizable Features: Tailor essential parameters such as growth rates, WACC, and tax rates to fit your forecasts.
- Efficient: Pre-constructed calculations save you from starting from ground zero.
- Professional-Quality Tool: Crafted for investors, analysts, and consultants in mind.
- User-Friendly Design: An intuitive layout along with step-by-step guidance makes it accessible for everyone.
Who Should Utilize This Product?
- Professional Investors: Create comprehensive and dependable valuation models for portfolio assessments.
- Corporate Finance Departments: Examine valuation scenarios to inform strategic decisions.
- Consultants and Advisors: Offer clients precise valuation insights for YTL Corporation Berhad (1773T).
- Students and Educators: Leverage real-world data to practice and instruct in financial modeling.
- Business Enthusiasts: Gain insights into how companies like YTL Corporation Berhad (1773T) are valued in the marketplace.
Contents of the YTL Corporation Template
- In-Depth DCF Model: Customizable template featuring intricate valuation calculations.
- Historical Data: Preloaded financials for YTL Corporation (1773T) to facilitate analysis.
- Adjustable Variables: Modify WACC, growth rates, and tax assumptions to explore different scenarios.
- Financial Statements: Comprehensive annual and quarterly details for enhanced understanding.
- Essential Ratios: Integrated analysis of profitability, efficiency, and leverage metrics.
- Visual Dashboard: Interactive charts and tables that present clear, actionable insights.
Disclaimer
All information, articles, and product details provided on this website are for general informational and educational purposes only. We do not claim any ownership over, nor do we intend to infringe upon, any trademarks, copyrights, logos, brand names, or other intellectual property mentioned or depicted on this site. Such intellectual property remains the property of its respective owners, and any references here are made solely for identification or informational purposes, without implying any affiliation, endorsement, or partnership.
We make no representations or warranties, express or implied, regarding the accuracy, completeness, or suitability of any content or products presented. Nothing on this website should be construed as legal, tax, investment, financial, medical, or other professional advice. In addition, no part of this site—including articles or product references—constitutes a solicitation, recommendation, endorsement, advertisement, or offer to buy or sell any securities, franchises, or other financial instruments, particularly in jurisdictions where such activity would be unlawful.
All content is of a general nature and may not address the specific circumstances of any individual or entity. It is not a substitute for professional advice or services. Any actions you take based on the information provided here are strictly at your own risk. You accept full responsibility for any decisions or outcomes arising from your use of this website and agree to release us from any liability in connection with your use of, or reliance upon, the content or products found herein.