
|
Golden Ponder Holdings Limited (1783.HK) Avaliação DCF |
Totalmente Editável: Adapte-Se Às Suas Necessidades No Excel Ou Planilhas
Design Profissional: Modelos Confiáveis E Padrão Da Indústria
Pré-Construídos Para Uso Rápido E Eficiente
Compatível com MAC/PC, totalmente desbloqueado
Não É Necessária Experiência; Fácil De Seguir
Golden Ponder Holdings Limited (1783.HK) Bundle
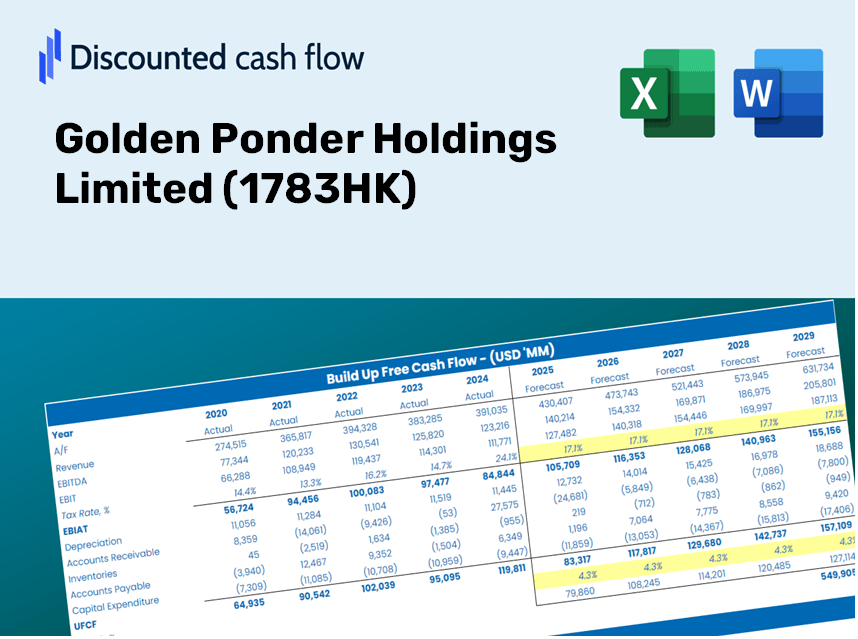
Avalie as perspectivas financeiras da Golden Ponder Holdings Limited como um especialista! Esta calculadora DCF (1783HK) fornece dados financeiros pré-preenchidos e flexibilidade para modificar o crescimento da receita, o WACC, as margens e outras suposições cruciais para se alinhar às suas projeções.
Discounted Cash Flow (DCF) - (USD MM)
| Year | AY1 2020 |
AY2 2021 |
AY3 2022 |
AY4 2023 |
AY5 2024 |
FY1 2025 |
FY2 2026 |
FY3 2027 |
FY4 2028 |
FY5 2029 |
|---|---|---|---|---|---|---|---|---|---|---|
| Revenue | 210.7 | 591.9 | 401.4 | 452.2 | 869.7 | 1,245.5 | 1,783.6 | 2,554.1 | 3,657.5 | 5,237.7 |
| Revenue Growth, % | 0 | 180.97 | -32.19 | 12.67 | 92.34 | 43.2 | 43.2 | 43.2 | 43.2 | 43.2 |
| EBITDA | -12.3 | -16.8 | -21.2 | -62.4 | 9.7 | -66.4 | -95.1 | -136.2 | -195.0 | -279.3 |
| EBITDA, % | -5.86 | -2.84 | -5.29 | -13.79 | 1.12 | -5.33 | -5.33 | -5.33 | -5.33 | -5.33 |
| Depreciation | 1.7 | 2.0 | 14.0 | 15.9 | 19.5 | 25.9 | 37.1 | 53.1 | 76.0 | 108.8 |
| Depreciation, % | 0.80177 | 0.33942 | 3.49 | 3.51 | 2.24 | 2.08 | 2.08 | 2.08 | 2.08 | 2.08 |
| EBIT | -14.0 | -18.8 | -35.2 | -78.3 | -9.8 | -92.3 | -132.2 | -189.3 | -271.0 | -388.1 |
| EBIT, % | -6.66 | -3.18 | -8.78 | -17.31 | -1.13 | -7.41 | -7.41 | -7.41 | -7.41 | -7.41 |
| Total Cash | 89.0 | 87.2 | 87.9 | 49.9 | 167.9 | 272.0 | 389.6 | 557.9 | 798.9 | 1,144.1 |
| Total Cash, percent | .0 | .0 | .0 | .0 | .0 | .0 | .0 | .0 | .0 | .0 |
| Account Receivables | 96.7 | .0 | 116.4 | 182.1 | 123.4 | 322.2 | 461.4 | 660.8 | 946.3 | 1,355.1 |
| Account Receivables, % | 45.89 | 0 | 29.01 | 40.27 | 14.19 | 25.87 | 25.87 | 25.87 | 25.87 | 25.87 |
| Inventories | .0 | .0 | .1 | .0 | .0 | .1 | .2 | .3 | .4 | .5 |
| Inventories, % | 0 | 0 | 0.03413462 | 0.00995153 | 0.00540398 | 0.00989803 | 0.00989803 | 0.00989803 | 0.00989803 | 0.00989803 |
| Accounts Payable | 52.1 | 138.6 | 11.8 | 152.7 | 91.4 | 237.6 | 340.2 | 487.2 | 697.7 | 999.1 |
| Accounts Payable, % | 24.74 | 23.42 | 2.93 | 33.76 | 10.51 | 19.07 | 19.07 | 19.07 | 19.07 | 19.07 |
| Capital Expenditure | -.2 | -.2 | -9.6 | -16.3 | -48.5 | -29.1 | -41.7 | -59.7 | -85.5 | -122.5 |
| Capital Expenditure, % | -0.08829393 | -0.02568001 | -2.39 | -3.61 | -5.57 | -2.34 | -2.34 | -2.34 | -2.34 | -2.34 |
| Tax Rate, % | -14.57 | -14.57 | -14.57 | -14.57 | -14.57 | -14.57 | -14.57 | -14.57 | -14.57 | -14.57 |
| EBITAT | -12.3 | -19.4 | -36.1 | -78.2 | -11.2 | -90.0 | -128.9 | -184.5 | -264.2 | -378.4 |
| Depreciation | ||||||||||
| Changes in Account Receivables | ||||||||||
| Changes in Inventories | ||||||||||
| Changes in Accounts Payable | ||||||||||
| Capital Expenditure | ||||||||||
| UFCF | -55.3 | 165.7 | -275.1 | -3.4 | -42.8 | -146.0 | -170.1 | -243.6 | -348.9 | -499.6 |
| WACC, % | 4.64 | 4.65 | 4.65 | 4.65 | 4.65 | 4.64 | 4.64 | 4.64 | 4.64 | 4.64 |
| PV UFCF | ||||||||||
| SUM PV UFCF | -1,196.6 | |||||||||
| Long Term Growth Rate, % | 4.00 | |||||||||
| Free cash flow (T + 1) | -520 | |||||||||
| Terminal Value | -80,646 | |||||||||
| Present Terminal Value | -64,269 | |||||||||
| Enterprise Value | -65,466 | |||||||||
| Net Debt | -68 | |||||||||
| Equity Value | -65,398 | |||||||||
| Diluted Shares Outstanding, MM | 2,582 | |||||||||
| Equity Value Per Share | -25.33 |
What You Will Receive
- Comprehensive 1783HK Financial Data: Pre-loaded with Golden Ponder Holdings Limited’s historical and projected figures for in-depth analysis.
- Customizable Template: Easily adjust essential inputs such as revenue growth, WACC, and EBITDA percentage.
- Instant Calculations: Watch the intrinsic value of 1783HK update in real-time as you make adjustments.
- Expert Valuation Tool: Crafted for investors, analysts, and consultants in search of reliable DCF outcomes.
- Intuitive Design: Clear layout and straightforward instructions suited for all skill levels.
Highlighted Features
- Customizable Forecast Inputs: Adjust essential parameters such as revenue growth, EBITDA %, and capital investments.
- Instant DCF Valuation: Quickly computes intrinsic value, NPV, and various other outputs.
- High-Precision Accuracy: Leverages Golden Ponder Holdings Limited’s (1783HK) actual financial data for realistic valuation results.
- Effortless Scenario Analysis: Evaluate different scenarios and compare results without hassle.
- Efficiency Booster: Avoid the complexity of building detailed valuation models from the ground up.
How It Operates
- Step 1: Download the Excel file.
- Step 2: Review the pre-filled data for Golden Ponder Holdings Limited (1783HK), including historical and projected figures.
- Step 3: Modify key assumptions in the highlighted cells (yellow) based on your assessment.
- Step 4: Observe the automatic recalculations reflecting the intrinsic value of Golden Ponder Holdings Limited (1783HK).
- Step 5: Utilize the results for your investment strategies or reporting needs.
Why Choose This Calculator for Golden Ponder Holdings Limited (1783HK)?
- All-in-One Solution: Features DCF, WACC, and comprehensive financial ratio analyses in a single tool.
- Flexible Inputs: Modify the yellow-highlighted cells to explore different financial scenarios.
- In-Depth Analysis: Automatically computes the intrinsic value and Net Present Value for Golden Ponder Holdings Limited.
- Preloaded Information: Utilizes historical and projected data to provide reliable starting figures.
- Professional Standard: Designed for financial analysts, investors, and business advisors.
Who Can Benefit from This Product?
- Investors: Assess the valuation of Golden Ponder Holdings Limited (1783HK) before making investment decisions.
- CFOs and Financial Analysts: Optimize valuation workflows and evaluate financial forecasts.
- Startup Founders: Discover the valuation methods applied to major public companies like Golden Ponder Holdings Limited (1783HK).
- Consultants: Provide clients with comprehensive and professional valuation analyses.
- Students and Educators: Utilize actual market data to learn and instruct on valuation methodologies.
Contents of the Template
- Pre-Filled DCF Model: Golden Ponder Holdings Limited's (1783HK) financial data ready for immediate application.
- WACC Calculator: Comprehensive calculations for the Weighted Average Cost of Capital.
- Financial Ratios: Assess Golden Ponder's (1783HK) profitability, leverage, and operational efficiency.
- Editable Inputs: Modify assumptions such as growth rates, profit margins, and capital expenditures to suit your scenarios.
- Financial Statements: Access annual and quarterly reports for in-depth analysis.
- Interactive Dashboard: Simplify the visualization of essential valuation metrics and outcomes.
Disclaimer
All information, articles, and product details provided on this website are for general informational and educational purposes only. We do not claim any ownership over, nor do we intend to infringe upon, any trademarks, copyrights, logos, brand names, or other intellectual property mentioned or depicted on this site. Such intellectual property remains the property of its respective owners, and any references here are made solely for identification or informational purposes, without implying any affiliation, endorsement, or partnership.
We make no representations or warranties, express or implied, regarding the accuracy, completeness, or suitability of any content or products presented. Nothing on this website should be construed as legal, tax, investment, financial, medical, or other professional advice. In addition, no part of this site—including articles or product references—constitutes a solicitation, recommendation, endorsement, advertisement, or offer to buy or sell any securities, franchises, or other financial instruments, particularly in jurisdictions where such activity would be unlawful.
All content is of a general nature and may not address the specific circumstances of any individual or entity. It is not a substitute for professional advice or services. Any actions you take based on the information provided here are strictly at your own risk. You accept full responsibility for any decisions or outcomes arising from your use of this website and agree to release us from any liability in connection with your use of, or reliance upon, the content or products found herein.