
|
Taisei Corporation (1801.T) Avaliação DCF |
Totalmente Editável: Adapte-Se Às Suas Necessidades No Excel Ou Planilhas
Design Profissional: Modelos Confiáveis E Padrão Da Indústria
Pré-Construídos Para Uso Rápido E Eficiente
Compatível com MAC/PC, totalmente desbloqueado
Não É Necessária Experiência; Fácil De Seguir
Taisei Corporation (1801.T) Bundle
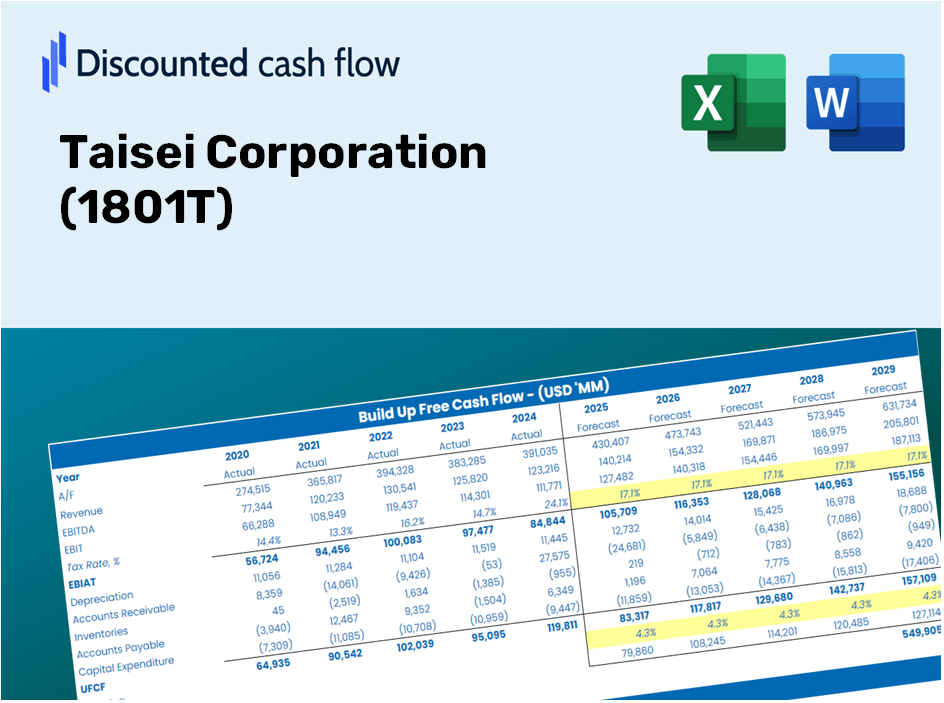
Procurando determinar o valor intrínseco da Taisei Corporation? Nossa calculadora DCF (1801T) integra dados do mundo real com recursos abrangentes de personalização, permitindo refinar suas previsões e fazer escolhas de investimento mais informadas.
Discounted Cash Flow (DCF) - (USD MM)
| Year | AY1 2021 |
AY2 2022 |
AY3 2023 |
AY4 2024 |
AY5 2025 |
FY1 2026 |
FY2 2027 |
FY3 2028 |
FY4 2029 |
FY5 2030 |
|---|---|---|---|---|---|---|---|---|---|---|
| Revenue | 1,480,141.0 | 1,543,239.0 | 1,642,712.0 | 1,765,023.0 | 2,154,223.0 | 2,370,749.8 | 2,609,040.2 | 2,871,281.9 | 3,159,882.2 | 3,477,490.5 |
| Revenue Growth, % | 0 | 4.26 | 6.45 | 7.45 | 22.05 | 10.05 | 10.05 | 10.05 | 10.05 | 10.05 |
| EBITDA | 146,891.0 | 115,364.0 | 80,478.0 | 71,418.0 | 197,215.0 | 168,322.1 | 185,240.6 | 203,859.7 | 224,350.1 | 246,900.2 |
| EBITDA, % | 9.92 | 7.48 | 4.9 | 4.05 | 9.15 | 7.1 | 7.1 | 7.1 | 7.1 | 7.1 |
| Depreciation | 10,502.0 | 10,950.0 | 11,521.0 | 13,242.0 | 16,391.0 | 17,218.9 | 18,949.7 | 20,854.3 | 22,950.5 | 25,257.3 |
| Depreciation, % | 0.70953 | 0.70955 | 0.70134 | 0.75025 | 0.76088 | 0.72631 | 0.72631 | 0.72631 | 0.72631 | 0.72631 |
| EBIT | 136,389.0 | 104,414.0 | 68,957.0 | 58,176.0 | 180,824.0 | 151,103.2 | 166,291.0 | 183,005.3 | 201,399.7 | 221,642.9 |
| EBIT, % | 9.21 | 6.77 | 4.2 | 3.3 | 8.39 | 6.37 | 6.37 | 6.37 | 6.37 | 6.37 |
| Total Cash | 494,307.0 | 499,113.0 | 415,950.0 | 434,711.0 | 300,689.0 | 614,716.9 | 676,503.8 | 744,501.0 | 819,332.8 | 901,686.2 |
| Total Cash, percent | .0 | .0 | .0 | .0 | .0 | .0 | .0 | .0 | .0 | .0 |
| Account Receivables | 539,709.0 | 575,500.0 | 688,586.0 | 864,319.0 | 938,807.0 | 987,283.6 | 1,086,518.1 | 1,195,727.0 | 1,315,912.7 | 1,448,178.7 |
| Account Receivables, % | 36.46 | 37.29 | 41.92 | 48.97 | 43.58 | 41.64 | 41.64 | 41.64 | 41.64 | 41.64 |
| Inventories | 173,966.0 | 168,663.0 | 203,100.0 | 253,037.0 | 264,682.0 | 292,403.7 | 321,794.0 | 354,138.4 | 389,733.8 | 428,907.0 |
| Inventories, % | 11.75 | 10.93 | 12.36 | 14.34 | 12.29 | 12.33 | 12.33 | 12.33 | 12.33 | 12.33 |
| Accounts Payable | 376,099.0 | 423,349.0 | 476,115.0 | 597,704.0 | 553,376.0 | 670,341.0 | 737,718.7 | 811,868.8 | 893,472.0 | 983,277.2 |
| Accounts Payable, % | 25.41 | 27.43 | 28.98 | 33.86 | 25.69 | 28.28 | 28.28 | 28.28 | 28.28 | 28.28 |
| Capital Expenditure | -12,725.0 | -13,230.0 | -16,163.0 | -122,308.0 | -31,939.0 | -52,692.7 | -57,989.0 | -63,817.6 | -70,232.1 | -77,291.3 |
| Capital Expenditure, % | -0.85972 | -0.85729 | -0.98392 | -6.93 | -1.48 | -2.22 | -2.22 | -2.22 | -2.22 | -2.22 |
| Tax Rate, % | 30.53 | 30.53 | 30.53 | 30.53 | 30.53 | 30.53 | 30.53 | 30.53 | 30.53 | 30.53 |
| EBITAT | 93,219.0 | 72,064.8 | 47,721.2 | 41,035.9 | 125,613.1 | 104,737.2 | 115,264.6 | 126,850.2 | 139,600.2 | 153,631.8 |
| Depreciation | ||||||||||
| Changes in Account Receivables | ||||||||||
| Changes in Inventories | ||||||||||
| Changes in Accounts Payable | ||||||||||
| Capital Expenditure | ||||||||||
| UFCF | -246,580.0 | 86,546.8 | -51,677.8 | -172,111.1 | -20,395.9 | 110,030.1 | 14,978.2 | 16,483.7 | 18,140.6 | 19,963.9 |
| WACC, % | 6.5 | 6.5 | 6.5 | 6.51 | 6.5 | 6.5 | 6.5 | 6.5 | 6.5 | 6.5 |
| PV UFCF | ||||||||||
| SUM PV UFCF | 158,834.1 | |||||||||
| Long Term Growth Rate, % | 3.00 | |||||||||
| Free cash flow (T + 1) | 20,563 | |||||||||
| Terminal Value | 587,230 | |||||||||
| Present Terminal Value | 428,575 | |||||||||
| Enterprise Value | 587,409 | |||||||||
| Net Debt | 77,270 | |||||||||
| Equity Value | 510,139 | |||||||||
| Diluted Shares Outstanding, MM | 181 | |||||||||
| Equity Value Per Share | 2,812.94 |
What You'll Receive
- Accurate 1801T Financials: Access both historical and projected data for precise assessment.
- Customizable Inputs: Adjust WACC, tax rates, revenue growth, and capital expenditures to fit your analysis.
- Automated Calculations: Instantly calculate intrinsic value and NPV with real-time updates.
- Scenario Testing: Explore various scenarios to gauge Taisei Corporation's future performance.
- User-Friendly Design: Designed for professionals but easy for novices to navigate.
Key Features
- Comprehensive DCF Calculator: Features detailed unlevered and levered DCF valuation models tailored for Taisei Corporation (1801T).
- WACC Calculation Tool: Pre-configured Weighted Average Cost of Capital sheet with adjustable inputs.
- Customizable Forecast Assumptions: Easily adjust growth rates, capital expenditures, and discount rates specific to Taisei Corporation (1801T).
- Integrated Financial Ratios: Evaluate profitability, leverage, and efficiency ratios for Taisei Corporation (1801T).
- Visual Dashboard and Charts: Graphical outputs that highlight essential valuation metrics for straightforward analysis.
How It Functions
- Download: Obtain the pre-configured Excel file featuring Taisei Corporation’s (1801T) financial data.
- Customize: Modify forecasts, including revenue growth, EBITDA %, and WACC to suit your needs.
- Update Automatically: Benefit from real-time updates on intrinsic value and NPV calculations.
- Test Scenarios: Generate various projections and instantly compare results.
- Make Decisions: Leverage the valuation outcomes to refine your investment strategy.
Why Opt for This Calculator?
- Designed for Experts: A sophisticated tool utilized by financial analysts, CFOs, and consultants.
- Accurate Data: Historical and projected financials for Taisei Corporation (1801T) are preloaded for precision.
- Versatile Scenario Testing: Effortlessly simulate various forecasts and assumptions.
- Insightful Outputs: Automatically computes intrinsic value, NPV, and other essential metrics.
- User-Friendly: Comprehensive step-by-step instructions to facilitate your calculations.
Who Can Benefit from This Product?
- Institutional Investors: Develop comprehensive and reliable valuation models for portfolio assessments related to Taisei Corporation (1801T).
- Corporate Finance Departments: Evaluate valuation scenarios to inform strategic decisions within the organization.
- Consultants and Financial Advisors: Deliver precise valuation insights regarding Taisei Corporation (1801T) to clients.
- Academics and Students: Utilize real-world data for hands-on experience in financial modeling and education.
- Construction Industry Enthusiasts: Gain insights into how companies like Taisei Corporation (1801T) are valued within the market.
Contents of the Template
- Pre-Filled DCF Model: Taisei Corporation’s financial data preloaded for immediate application.
- WACC Calculator: Comprehensive calculations for the Weighted Average Cost of Capital.
- Financial Ratios: Assess Taisei Corporation's profitability, leverage, and operational efficiency.
- Editable Inputs: Modify assumptions such as growth rates, profit margins, and capital expenditures to suit your analysis.
- Financial Statements: Annual and quarterly reports available for in-depth evaluation.
- Interactive Dashboard: Effortlessly visualize essential valuation metrics and outcomes.
Disclaimer
All information, articles, and product details provided on this website are for general informational and educational purposes only. We do not claim any ownership over, nor do we intend to infringe upon, any trademarks, copyrights, logos, brand names, or other intellectual property mentioned or depicted on this site. Such intellectual property remains the property of its respective owners, and any references here are made solely for identification or informational purposes, without implying any affiliation, endorsement, or partnership.
We make no representations or warranties, express or implied, regarding the accuracy, completeness, or suitability of any content or products presented. Nothing on this website should be construed as legal, tax, investment, financial, medical, or other professional advice. In addition, no part of this site—including articles or product references—constitutes a solicitation, recommendation, endorsement, advertisement, or offer to buy or sell any securities, franchises, or other financial instruments, particularly in jurisdictions where such activity would be unlawful.
All content is of a general nature and may not address the specific circumstances of any individual or entity. It is not a substitute for professional advice or services. Any actions you take based on the information provided here are strictly at your own risk. You accept full responsibility for any decisions or outcomes arising from your use of this website and agree to release us from any liability in connection with your use of, or reliance upon, the content or products found herein.