
|
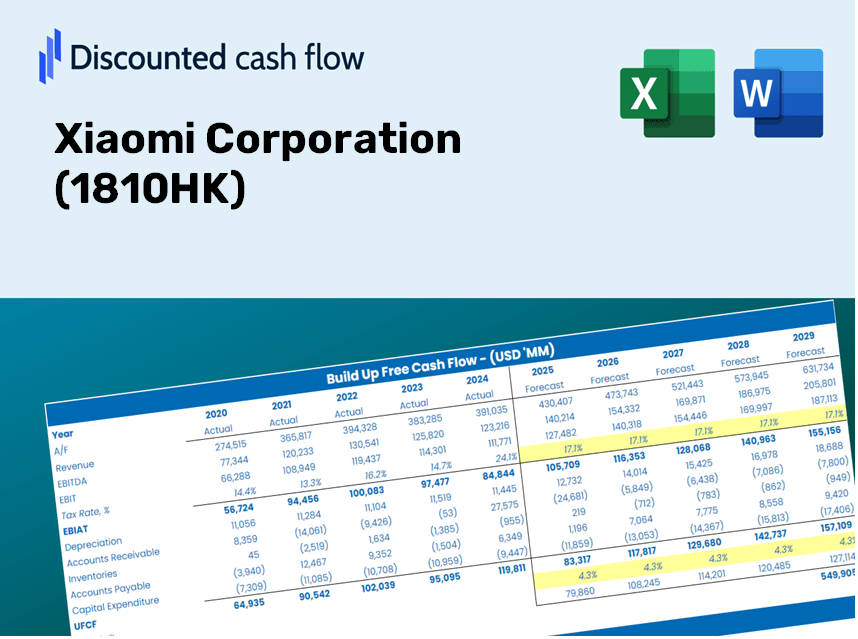
Xiaomi Corporation (1810.HK) Avaliação DCF |
Totalmente Editável: Adapte-Se Às Suas Necessidades No Excel Ou Planilhas
Design Profissional: Modelos Confiáveis E Padrão Da Indústria
Pré-Construídos Para Uso Rápido E Eficiente
Compatível com MAC/PC, totalmente desbloqueado
Não É Necessária Experiência; Fácil De Seguir
Xiaomi Corporation (1810.HK) Bundle
Simplifique a avaliação da Xiaomi Corporation (1810HK) com esta calculadora DCF personalizável! Com o REAL Xiaomi Corporation (1810HK) financeiras e insumos de previsão ajustáveis, você pode testar cenários e descobrir o valor justo da Xiaomi Corporation (1810HK) em minutos.
What You Will Receive
- Pre-Populated Financial Model: Utilize Xiaomi’s actual performance data for accurate DCF valuation.
- Comprehensive Forecast Control: Modify revenue growth, profit margins, WACC, and other essential variables.
- Real-Time Calculations: Automatic updates provide immediate insights as changes are made.
- Investor-Ready Template: A polished Excel workbook designed for high-level valuation analysis.
- Customizable and Reusable: Crafted for adaptability, facilitating repeated use for in-depth forecasts.
Key Features
- Real-Time 1810HK Data: Pre-filled with Xiaomi’s historical financial performance and future projections.
- Completely Customizable Inputs: Modify revenue growth rates, profit margins, WACC, tax rates, and capital expenditures as needed.
- Interactive Valuation Model: Automatic recalculations of Net Present Value (NPV) and intrinsic value based on user inputs.
- Scenario Analysis: Develop various forecast scenarios to evaluate distinct valuation results.
- User-Centric Design: Intuitive, organized, and suitable for both experienced professionals and newcomers.
How It Operates
- Download the Template: Gain immediate access to the Excel-based Xiaomi DCF Calculator for (1810HK).
- Input Your Assumptions: Modify the yellow-highlighted cells to set growth rates, WACC, profit margins, and more.
- Instant Calculations: The model automatically recalculates Xiaomi’s intrinsic value.
- Test Scenarios: Experiment with different assumptions to assess potential changes in valuation.
- Analyze and Decide: Utilize the results to inform your investment strategy or financial analysis.
Why Select This Calculator?
- Designed for Experts: A sophisticated tool utilized by analysts, CFOs, and consultants.
- Accurate Data: Xiaomi's historical and projected financials are preloaded for precision.
- Scenario Analysis: Effortlessly simulate various forecasts and assumptions.
- Concise Outputs: Instantly computes intrinsic value, NPV, and essential metrics.
- User-Friendly: Step-by-step guidance navigates you through the process.
Who Can Benefit from This Product?
- Finance Students: Master valuation methods and put them into practice with actual data.
- Academics: Utilize industry-standard models in your classes or research projects.
- Investors: Evaluate your own hypotheses and review valuation results for Xiaomi Corporation (1810HK).
- Analysts: Optimize your analysis process with a ready-made, adaptable DCF model.
- Small Business Owners: Discover how major public companies like Xiaomi Corporation (1810HK) are evaluated.
Contents of the Template
- Operating and Balance Sheet Data: Pre-filled historical data and forecasts for Xiaomi Corporation (1810HK), including revenue, EBITDA, EBIT, and capital expenditures.
- WACC Calculation: A dedicated sheet for calculating the Weighted Average Cost of Capital (WACC), featuring key parameters such as Beta, risk-free rate, and share price.
- DCF Valuation (Unlevered and Levered): Editable Discounted Cash Flow models that provide intrinsic value insights along with detailed calculations.
- Financial Statements: Pre-loaded financial statements (annual and quarterly) to facilitate in-depth analysis.
- Key Ratios: Includes key profitability, leverage, and efficiency ratios specific to Xiaomi Corporation (1810HK).
- Dashboard and Charts: Visual representation of valuation outputs and assumptions for easy result analysis.
Disclaimer
All information, articles, and product details provided on this website are for general informational and educational purposes only. We do not claim any ownership over, nor do we intend to infringe upon, any trademarks, copyrights, logos, brand names, or other intellectual property mentioned or depicted on this site. Such intellectual property remains the property of its respective owners, and any references here are made solely for identification or informational purposes, without implying any affiliation, endorsement, or partnership.
We make no representations or warranties, express or implied, regarding the accuracy, completeness, or suitability of any content or products presented. Nothing on this website should be construed as legal, tax, investment, financial, medical, or other professional advice. In addition, no part of this site—including articles or product references—constitutes a solicitation, recommendation, endorsement, advertisement, or offer to buy or sell any securities, franchises, or other financial instruments, particularly in jurisdictions where such activity would be unlawful.
All content is of a general nature and may not address the specific circumstances of any individual or entity. It is not a substitute for professional advice or services. Any actions you take based on the information provided here are strictly at your own risk. You accept full responsibility for any decisions or outcomes arising from your use of this website and agree to release us from any liability in connection with your use of, or reliance upon, the content or products found herein.