
|
Toyo Construction Co., Ltd. (1890.T) Avaliação DCF |
Totalmente Editável: Adapte-Se Às Suas Necessidades No Excel Ou Planilhas
Design Profissional: Modelos Confiáveis E Padrão Da Indústria
Pré-Construídos Para Uso Rápido E Eficiente
Compatível com MAC/PC, totalmente desbloqueado
Não É Necessária Experiência; Fácil De Seguir
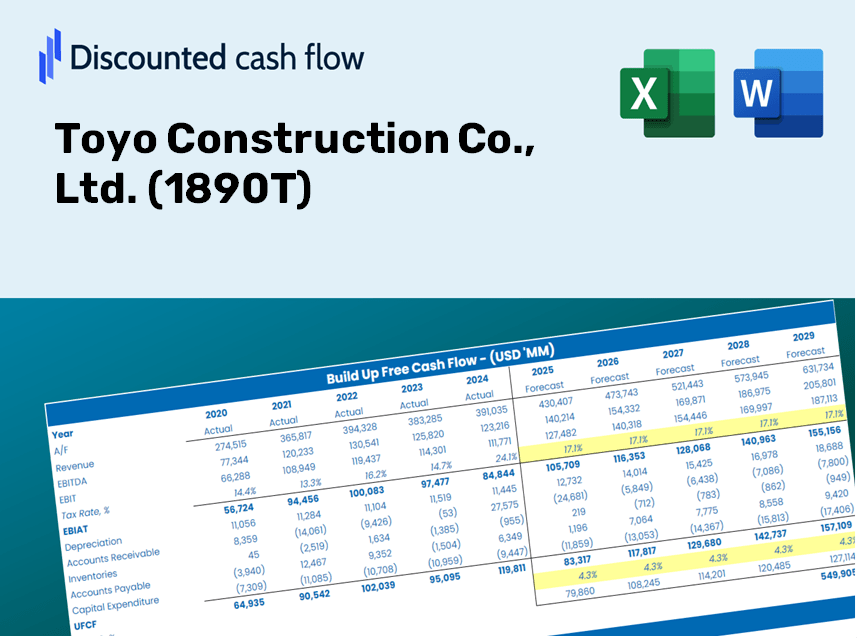
Toyo Construction Co., Ltd. (1890.T) Bundle
Simplifique sua análise e melhore a precisão com a nossa calculadora DCF (1890T)! Utilizando dados reais da Toyo Construction Co., Ltd. e suposições personalizáveis, essa ferramenta permite que você preveja, analise e avalie a construção da Toyo como um investidor experiente.
Discounted Cash Flow (DCF) - (USD MM)
| Year | AY1 2020 |
AY2 2021 |
AY3 2022 |
AY4 2023 |
AY5 2024 |
FY1 2025 |
FY2 2026 |
FY3 2027 |
FY4 2028 |
FY5 2029 |
|---|---|---|---|---|---|---|---|---|---|---|
| Revenue | 172,975.0 | 152,524.0 | 168,351.0 | 186,781.0 | 172,605.0 | 173,429.8 | 174,258.5 | 175,091.2 | 175,927.8 | 176,768.5 |
| Revenue Growth, % | 0 | -11.82 | 10.38 | 10.95 | -7.59 | 0.47784 | 0.47784 | 0.47784 | 0.47784 | 0.47784 |
| EBITDA | 15,987.0 | 10,625.0 | 10,649.0 | 12,946.0 | 14,048.0 | 13,043.3 | 13,105.6 | 13,168.2 | 13,231.1 | 13,294.4 |
| EBITDA, % | 9.24 | 6.97 | 6.33 | 6.93 | 8.14 | 7.52 | 7.52 | 7.52 | 7.52 | 7.52 |
| Depreciation | 1,727.0 | 1,611.0 | 1,652.0 | 2,843.0 | 1,575.0 | 1,897.5 | 1,906.6 | 1,915.7 | 1,924.8 | 1,934.0 |
| Depreciation, % | 0.99841 | 1.06 | 0.98128 | 1.52 | 0.91249 | 1.09 | 1.09 | 1.09 | 1.09 | 1.09 |
| EBIT | 14,260.0 | 9,014.0 | 8,997.0 | 10,103.0 | 12,473.0 | 11,145.8 | 11,199.0 | 11,252.5 | 11,306.3 | 11,360.3 |
| EBIT, % | 8.24 | 5.91 | 5.34 | 5.41 | 7.23 | 6.43 | 6.43 | 6.43 | 6.43 | 6.43 |
| Total Cash | 16,770.0 | 30,585.0 | 39,108.0 | 23,575.0 | 21,254.0 | 27,024.9 | 27,154.0 | 27,283.8 | 27,414.2 | 27,545.1 |
| Total Cash, percent | .0 | .0 | .0 | .0 | .0 | .0 | .0 | .0 | .0 | .0 |
| Account Receivables | 80,473.0 | 57,036.0 | 67,923.0 | 84,066.0 | 90,887.0 | 76,977.7 | 77,345.5 | 77,715.1 | 78,086.5 | 78,459.6 |
| Account Receivables, % | 46.52 | 37.39 | 40.35 | 45.01 | 52.66 | 44.39 | 44.39 | 44.39 | 44.39 | 44.39 |
| Inventories | 2,763.0 | 2,491.0 | 2,158.0 | 2,105.0 | 3,349.0 | 2,629.1 | 2,641.6 | 2,654.3 | 2,666.9 | 2,679.7 |
| Inventories, % | 1.6 | 1.63 | 1.28 | 1.13 | 1.94 | 1.52 | 1.52 | 1.52 | 1.52 | 1.52 |
| Accounts Payable | 32,226.0 | 29,749.0 | 33,729.0 | 32,397.0 | 30,617.0 | 32,345.7 | 32,500.2 | 32,655.5 | 32,811.6 | 32,968.4 |
| Accounts Payable, % | 18.63 | 19.5 | 20.03 | 17.34 | 17.74 | 18.65 | 18.65 | 18.65 | 18.65 | 18.65 |
| Capital Expenditure | -1,081.0 | -1,174.0 | -968.0 | -7,882.0 | -12,906.0 | -4,740.4 | -4,763.1 | -4,785.9 | -4,808.7 | -4,831.7 |
| Capital Expenditure, % | -0.62495 | -0.76971 | -0.57499 | -4.22 | -7.48 | -2.73 | -2.73 | -2.73 | -2.73 | -2.73 |
| Tax Rate, % | 32 | 32 | 32 | 32 | 32 | 32 | 32 | 32 | 32 | 32 |
| EBITAT | 9,700.5 | 5,926.1 | 5,729.2 | 7,120.3 | 8,481.7 | 7,488.3 | 7,524.1 | 7,560.0 | 7,596.2 | 7,632.5 |
| Depreciation | ||||||||||
| Changes in Account Receivables | ||||||||||
| Changes in Inventories | ||||||||||
| Changes in Accounts Payable | ||||||||||
| Capital Expenditure | ||||||||||
| UFCF | -40,663.5 | 27,595.1 | -160.8 | -15,340.7 | -12,694.3 | 21,003.3 | 4,441.7 | 4,463.0 | 4,484.3 | 4,505.7 |
| WACC, % | 4.27 | 4.26 | 4.25 | 4.28 | 4.27 | 4.26 | 4.26 | 4.26 | 4.26 | 4.26 |
| PV UFCF | ||||||||||
| SUM PV UFCF | 35,619.7 | |||||||||
| Long Term Growth Rate, % | 3.00 | |||||||||
| Free cash flow (T + 1) | 4,641 | |||||||||
| Terminal Value | 367,515 | |||||||||
| Present Terminal Value | 298,283 | |||||||||
| Enterprise Value | 333,903 | |||||||||
| Net Debt | 2,751 | |||||||||
| Equity Value | 331,152 | |||||||||
| Diluted Shares Outstanding, MM | 94 | |||||||||
| Equity Value Per Share | 3,525.65 |
Benefits You Will Receive
- Genuine TYO Financials: Access historical and projected data for precise valuation.
- Customizable Parameters: Adjust WACC, tax rates, revenue growth, and capital expenditures.
- Automatic Calculations: Dynamic calculation of intrinsic value and NPV.
- Scenario Analysis: Evaluate various scenarios to assess Toyo Construction's future performance.
- User-Friendly Design: Tailored for professionals while remaining accessible to newcomers.
Key Features
- Comprehensive Historical Data: Access Toyo Construction’s financial statements and pre-populated forecasts.
- Customizable Variables: Modify WACC, tax rates, revenue growth, and EBITDA margins to fit your analysis.
- Real-Time Calculations: Watch Toyo Construction’s intrinsic value update instantly.
- Intuitive Visual Displays: Dashboard graphs present valuation outcomes and essential metrics clearly.
- Designed for Precision: A specialized tool tailored for analysts, investors, and finance professionals.
How It Operates
- Step 1: Download the Excel spreadsheet.
- Step 2: Examine the pre-filled Toyo Construction data (historical and projected).
- Step 3: Modify key assumptions (highlighted in yellow) according to your analysis.
- Step 4: Observe real-time recalculations for Toyo Construction’s intrinsic value.
- Step 5: Utilize the results for investment evaluations or reporting purposes.
Why Choose Toyo Construction Co., Ltd. (1890T)?
- Reliability: Trustworthy financial data for informed decision-making.
- Customization: Users can easily adjust inputs to suit their specific needs.
- Efficiency: Eliminate the complexity of creating a financial model from the ground up.
- Expert-Level Quality: Crafted with the accuracy and functionality expected from industry leaders.
- Intuitive Interface: Designed for ease of use, accessible even for those new to financial modeling.
Who Can Benefit from This Product?
- Construction Management Students: Master project management techniques and apply them using real industry data.
- Researchers: Integrate advanced construction models into studies or academic projects.
- Investors: Validate your investment strategies and assess valuation outcomes for Toyo Construction Co., Ltd. (1890T).
- Industry Analysts: Optimize your analysis process with a ready-to-use, customizable financial model.
- Contractors and Small Business Owners: Understand how major firms like Toyo Construction Co., Ltd. (1890T) evaluate projects and financial performance.
What the Template Includes
- Comprehensive DCF Model: An editable template featuring detailed valuation calculations.
- Real-World Data: Toyo Construction Co., Ltd.’s (1890T) historical and projected financials preloaded for comprehensive analysis.
- Customizable Parameters: Modify WACC, growth rates, and tax assumptions to explore various scenarios.
- Financial Statements: Complete annual and quarterly breakdowns for enhanced insights.
- Key Ratios: Integrated analysis for assessing profitability, efficiency, and leverage.
- Dashboard with Visual Outputs: Visuals like charts and tables to present clear, actionable results.
Disclaimer
All information, articles, and product details provided on this website are for general informational and educational purposes only. We do not claim any ownership over, nor do we intend to infringe upon, any trademarks, copyrights, logos, brand names, or other intellectual property mentioned or depicted on this site. Such intellectual property remains the property of its respective owners, and any references here are made solely for identification or informational purposes, without implying any affiliation, endorsement, or partnership.
We make no representations or warranties, express or implied, regarding the accuracy, completeness, or suitability of any content or products presented. Nothing on this website should be construed as legal, tax, investment, financial, medical, or other professional advice. In addition, no part of this site—including articles or product references—constitutes a solicitation, recommendation, endorsement, advertisement, or offer to buy or sell any securities, franchises, or other financial instruments, particularly in jurisdictions where such activity would be unlawful.
All content is of a general nature and may not address the specific circumstances of any individual or entity. It is not a substitute for professional advice or services. Any actions you take based on the information provided here are strictly at your own risk. You accept full responsibility for any decisions or outcomes arising from your use of this website and agree to release us from any liability in connection with your use of, or reliance upon, the content or products found herein.