
|
Penta-Ocean Construction Co., Ltd. (1893.T) Avaliação DCF |
Totalmente Editável: Adapte-Se Às Suas Necessidades No Excel Ou Planilhas
Design Profissional: Modelos Confiáveis E Padrão Da Indústria
Pré-Construídos Para Uso Rápido E Eficiente
Compatível com MAC/PC, totalmente desbloqueado
Não É Necessária Experiência; Fácil De Seguir
Penta-Ocean Construction Co., Ltd. (1893.T) Bundle
Avalie as perspectivas financeiras da Penta-Ocean Construction Co., Ltd. Como um especialista! Esta calculadora DCF (1893T) vem com finanças pré-preenchidas e oferece total flexibilidade para modificar o crescimento da receita, WACC, margens e outras suposições essenciais para se alinhar às suas projeções.
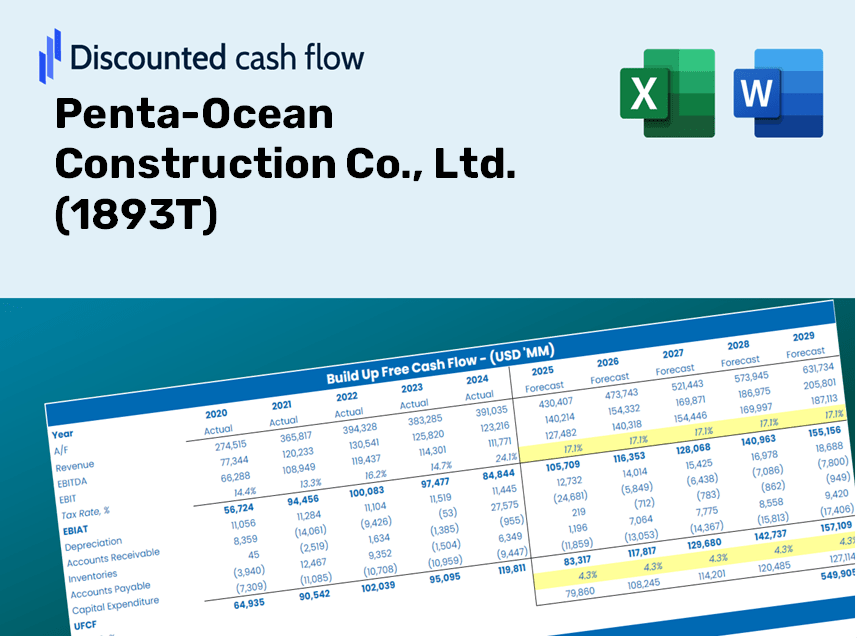
Discounted Cash Flow (DCF) - (USD MM)
| Year | AY1 2020 |
AY2 2021 |
AY3 2022 |
AY4 2023 |
AY5 2024 |
FY1 2025 |
FY2 2026 |
FY3 2027 |
FY4 2028 |
FY5 2029 |
|---|---|---|---|---|---|---|---|---|---|---|
| Revenue | 471,058.0 | 458,231.0 | 502,205.0 | 617,708.0 | 727,491.0 | 814,144.7 | 911,120.1 | 1,019,646.5 | 1,141,099.8 | 1,277,019.8 |
| Revenue Growth, % | 0 | -2.72 | 9.6 | 23 | 17.77 | 11.91 | 11.91 | 11.91 | 11.91 | 11.91 |
| EBITDA | 38,119.0 | 23,458.0 | 10,161.0 | 37,297.0 | 30,517.0 | 41,468.5 | 46,408.0 | 51,935.8 | 58,122.0 | 65,045.1 |
| EBITDA, % | 8.09 | 5.12 | 2.02 | 6.04 | 4.19 | 5.09 | 5.09 | 5.09 | 5.09 | 5.09 |
| Depreciation | 7,517.0 | 6,749.0 | 7,537.0 | 7,899.0 | 8,894.0 | 11,513.2 | 12,884.5 | 14,419.2 | 16,136.8 | 18,058.9 |
| Depreciation, % | 1.6 | 1.47 | 1.5 | 1.28 | 1.22 | 1.41 | 1.41 | 1.41 | 1.41 | 1.41 |
| EBIT | 30,602.0 | 16,709.0 | 2,624.0 | 29,398.0 | 21,623.0 | 29,955.4 | 33,523.4 | 37,516.5 | 41,985.2 | 46,986.2 |
| EBIT, % | 6.5 | 3.65 | 0.5225 | 4.76 | 2.97 | 3.68 | 3.68 | 3.68 | 3.68 | 3.68 |
| Total Cash | 59,789.0 | 44,856.0 | 50,500.0 | 60,189.0 | 57,270.0 | 81,664.1 | 91,391.3 | 102,277.2 | 114,459.8 | 128,093.5 |
| Total Cash, percent | .0 | .0 | .0 | .0 | .0 | .0 | .0 | .0 | .0 | .0 |
| Account Receivables | 257,837.0 | 275,540.0 | 292,026.0 | 334,945.0 | 396,810.0 | 458,826.9 | 513,479.2 | 574,641.3 | 643,088.6 | 719,689.0 |
| Account Receivables, % | 54.74 | 60.13 | 58.15 | 54.22 | 54.55 | 56.36 | 56.36 | 56.36 | 56.36 | 56.36 |
| Inventories | 14,293.0 | 16,123.0 | 16,587.0 | 22,619.0 | 21,801.0 | 26,889.7 | 30,092.7 | 33,677.1 | 37,688.5 | 42,177.7 |
| Inventories, % | 3.03 | 3.52 | 3.3 | 3.66 | 3 | 3.3 | 3.3 | 3.3 | 3.3 | 3.3 |
| Accounts Payable | 117,482.0 | 117,852.0 | 124,327.0 | 138,508.0 | 156,821.0 | 194,408.8 | 217,565.4 | 243,480.3 | 272,482.0 | 304,938.2 |
| Accounts Payable, % | 24.94 | 25.72 | 24.76 | 22.42 | 21.56 | 23.88 | 23.88 | 23.88 | 23.88 | 23.88 |
| Capital Expenditure | -11,041.0 | -8,657.0 | -10,114.0 | -10,887.0 | -38,151.0 | -21,580.8 | -24,151.4 | -27,028.1 | -30,247.6 | -33,850.4 |
| Capital Expenditure, % | -2.34 | -1.89 | -2.01 | -1.76 | -5.24 | -2.65 | -2.65 | -2.65 | -2.65 | -2.65 |
| Tax Rate, % | 35.33 | 35.33 | 35.33 | 35.33 | 35.33 | 35.33 | 35.33 | 35.33 | 35.33 | 35.33 |
| EBITAT | 21,297.1 | 11,178.5 | 1,074.1 | 19,174.2 | 13,983.6 | 18,411.9 | 20,605.0 | 23,059.3 | 25,805.9 | 28,879.8 |
| Depreciation | ||||||||||
| Changes in Account Receivables | ||||||||||
| Changes in Inventories | ||||||||||
| Changes in Accounts Payable | ||||||||||
| Capital Expenditure | ||||||||||
| UFCF | -136,874.9 | -9,892.5 | -11,977.9 | -18,583.8 | -58,007.4 | -21,173.7 | -25,360.5 | -28,381.3 | -31,761.9 | -35,545.1 |
| WACC, % | 5.58 | 5.55 | 5.23 | 5.53 | 5.52 | 5.48 | 5.48 | 5.48 | 5.48 | 5.48 |
| PV UFCF | ||||||||||
| SUM PV UFCF | -119,932.1 | |||||||||
| Long Term Growth Rate, % | 3.50 | |||||||||
| Free cash flow (T + 1) | -36,789 | |||||||||
| Terminal Value | -1,858,097 | |||||||||
| Present Terminal Value | -1,423,046 | |||||||||
| Enterprise Value | -1,542,978 | |||||||||
| Net Debt | 109,205 | |||||||||
| Equity Value | -1,652,183 | |||||||||
| Diluted Shares Outstanding, MM | 282 | |||||||||
| Equity Value Per Share | -5,850.42 |
What You'll Receive
- Genuine Penta-Ocean Data: Loaded financials – encompassing revenue to EBIT – grounded in actual and projected figures.
- Complete Customization: Modify all essential parameters (yellow cells) such as WACC, growth %, and tax rates.
- Real-Time Valuation Updates: Automatic recalculations to assess the effects of changes on Penta-Ocean’s fair value.
- Flexible Excel Template: Designed for easy edits, scenario testing, and comprehensive forecasts.
- Efficient and Precise: Avoid starting from scratch while ensuring accuracy and adaptability.
Key Features
- Pre-Loaded Data: Penta-Ocean Construction’s historical financial statements and pre-filled forecasts.
- Fully Adjustable Inputs: Customize parameters such as WACC, tax rates, revenue growth, and EBITDA margins.
- Instant Results: View Penta-Ocean Construction’s intrinsic value recalculating in real time.
- Clear Visual Outputs: Dashboard charts provide a visual representation of valuation results and key metrics.
- Built for Accuracy: A professional tool designed for analysts, investors, and finance professionals.
How It Works
- 1. Access the Template: Download and open the Excel file containing Penta-Ocean Construction Co., Ltd.'s preloaded data.
- 2. Modify Assumptions: Adjust key inputs such as growth rates, WACC, and capital expenditures.
- 3. View Results in Real-Time: The DCF model calculates intrinsic value and NPV automatically.
- 4. Explore Different Scenarios: Analyze various forecasts to understand diverse valuation outcomes.
- 5. Present with Confidence: Share professional valuation insights to reinforce your decision-making process.
Why Choose Penta-Ocean Construction Co., Ltd. (1893T) Calculator?
- Precision: Utilizes real financial data from Penta-Ocean for enhanced accuracy.
- Versatility: Tailored for users to explore and adjust inputs at will.
- Efficiency: Eliminate the need to create a financial model from the ground up.
- Expert Quality: Crafted with the precision and usability expected from a leading construction firm.
- Intuitive Design: Simple to navigate, making it accessible for all users, regardless of their financial modeling skills.
Who Can Benefit from Penta-Ocean Construction Co., Ltd. (1893T)?
- Investors: Make informed investment choices with our reliable financial insights.
- Project Managers: Streamline project evaluations using our comprehensive analysis tools.
- Consultants: Easily tailor our resources for client proposals or detailed reports.
- Construction Professionals: Enhance your expertise with practical examples from our extensive project history.
- Students and Educators: Leverage our offerings as a hands-on learning resource in construction management courses.
Contents of the Template
- Pre-Filled Data: Contains historical financials and forecasts for Penta-Ocean Construction Co., Ltd. (1893T).
- Discounted Cash Flow Model: An editable DCF valuation model featuring automatic calculations.
- Weighted Average Cost of Capital (WACC): A dedicated section for calculating WACC with custom inputs.
- Key Financial Ratios: Evaluate Penta-Ocean's profitability, efficiency, and leverage metrics.
- Customizable Inputs: Easily modify revenue growth, margins, and tax rates.
- Clear Dashboard: Visuals and tables presenting a summary of key valuation outcomes.
Disclaimer
All information, articles, and product details provided on this website are for general informational and educational purposes only. We do not claim any ownership over, nor do we intend to infringe upon, any trademarks, copyrights, logos, brand names, or other intellectual property mentioned or depicted on this site. Such intellectual property remains the property of its respective owners, and any references here are made solely for identification or informational purposes, without implying any affiliation, endorsement, or partnership.
We make no representations or warranties, express or implied, regarding the accuracy, completeness, or suitability of any content or products presented. Nothing on this website should be construed as legal, tax, investment, financial, medical, or other professional advice. In addition, no part of this site—including articles or product references—constitutes a solicitation, recommendation, endorsement, advertisement, or offer to buy or sell any securities, franchises, or other financial instruments, particularly in jurisdictions where such activity would be unlawful.
All content is of a general nature and may not address the specific circumstances of any individual or entity. It is not a substitute for professional advice or services. Any actions you take based on the information provided here are strictly at your own risk. You accept full responsibility for any decisions or outcomes arising from your use of this website and agree to release us from any liability in connection with your use of, or reliance upon, the content or products found herein.