
|
Daiwa House Industry Co., Ltd. (1925.T) Avaliação DCF |
Totalmente Editável: Adapte-Se Às Suas Necessidades No Excel Ou Planilhas
Design Profissional: Modelos Confiáveis E Padrão Da Indústria
Pré-Construídos Para Uso Rápido E Eficiente
Compatível com MAC/PC, totalmente desbloqueado
Não É Necessária Experiência; Fácil De Seguir
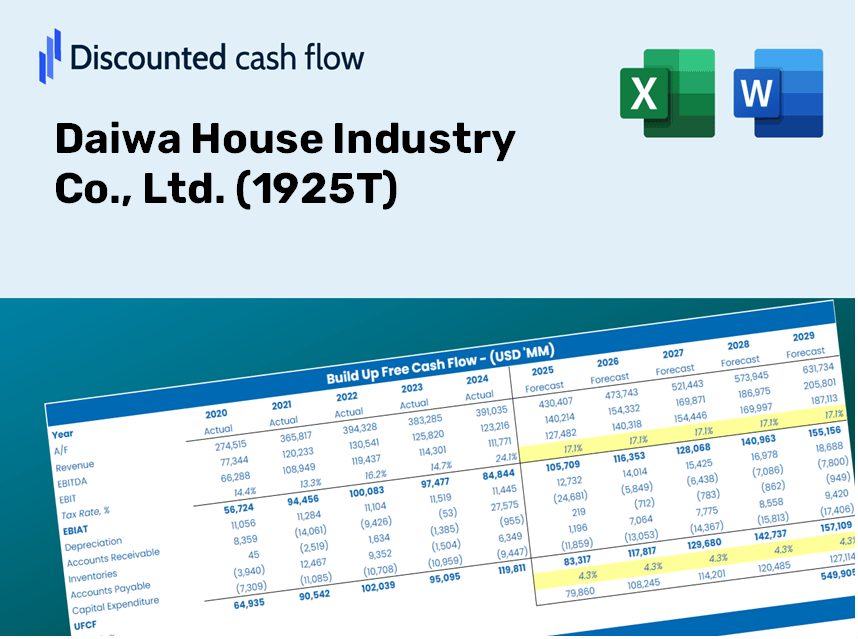
Daiwa House Industry Co., Ltd. (1925.T) Bundle
Streamline Daiwa House Industry Co., Ltd. (1925T) Avaliação com esta calculadora DCF personalizável! Equipado com a Daiwa House Industry Co., Ltd. Financeiras e variáveis de previsão ajustáveis, você pode explorar cenários e revelar o valor justo da Daiwa House Industry Co., Ltd. em apenas alguns minutos.
Discounted Cash Flow (DCF) - (USD MM)
| Year | AY1 2021 |
AY2 2022 |
AY3 2023 |
AY4 2024 |
AY5 2025 |
FY1 2026 |
FY2 2027 |
FY3 2028 |
FY4 2029 |
FY5 2030 |
|---|---|---|---|---|---|---|---|---|---|---|
| Revenue | 4,126,769.0 | 4,439,536.0 | 4,908,199.0 | 5,202,919.0 | 5,434,819.0 | 5,705,737.3 | 5,990,160.5 | 6,288,761.8 | 6,602,248.0 | 6,931,361.1 |
| Revenue Growth, % | 0 | 7.58 | 10.56 | 6 | 4.46 | 4.98 | 4.98 | 4.98 | 4.98 | 4.98 |
| EBITDA | 399,626.0 | 466,661.0 | 577,986.0 | 604,569.0 | 662,132.0 | 636,464.9 | 668,191.8 | 701,500.2 | 736,469.0 | 773,181.0 |
| EBITDA, % | 9.68 | 10.51 | 11.78 | 11.62 | 12.18 | 11.15 | 11.15 | 11.15 | 11.15 | 11.15 |
| Depreciation | 78,403.0 | 100,328.0 | 119,188.0 | 117,204.0 | 131,786.0 | 128,557.0 | 134,965.4 | 141,693.2 | 148,756.4 | 156,171.7 |
| Depreciation, % | 1.9 | 2.26 | 2.43 | 2.25 | 2.42 | 2.25 | 2.25 | 2.25 | 2.25 | 2.25 |
| EBIT | 321,223.0 | 366,333.0 | 458,798.0 | 487,365.0 | 530,346.0 | 507,907.9 | 533,226.4 | 559,807.0 | 587,712.6 | 617,009.3 |
| EBIT, % | 7.78 | 8.25 | 9.35 | 9.37 | 9.76 | 8.9 | 8.9 | 8.9 | 8.9 | 8.9 |
| Total Cash | 426,530.0 | 345,200.0 | 361,656.0 | 450,578.0 | 333,600.0 | 459,631.2 | 482,543.1 | 506,597.3 | 531,850.4 | 558,362.5 |
| Total Cash, percent | .0 | .0 | .0 | .0 | .0 | .0 | .0 | .0 | .0 | .0 |
| Account Receivables | 462,131.0 | 507,583.0 | 565,776.0 | 640,061.0 | 668,130.0 | 670,472.6 | 703,894.8 | 738,982.9 | 775,820.2 | 814,493.8 |
| Account Receivables, % | 11.2 | 11.43 | 11.53 | 12.3 | 12.29 | 11.75 | 11.75 | 11.75 | 11.75 | 11.75 |
| Inventories | 1,173,610.0 | 1,562,407.0 | 2,091,674.0 | 2,287,761.0 | 2,571,635.0 | 2,254,181.4 | 2,366,549.3 | 2,484,518.6 | 2,608,368.4 | 2,738,392.0 |
| Inventories, % | 28.44 | 35.19 | 42.62 | 43.97 | 47.32 | 39.51 | 39.51 | 39.51 | 39.51 | 39.51 |
| Accounts Payable | 296,165.0 | 355,936.0 | 380,004.0 | 361,313.0 | 353,710.0 | 415,251.8 | 435,951.6 | 457,683.2 | 480,498.0 | 504,450.2 |
| Accounts Payable, % | 7.18 | 8.02 | 7.74 | 6.94 | 6.51 | 7.28 | 7.28 | 7.28 | 7.28 | 7.28 |
| Capital Expenditure | -334,698.0 | -410,981.0 | -486,516.0 | -356,048.0 | -381,786.0 | -469,560.2 | -492,967.1 | -517,540.8 | -543,339.6 | -570,424.3 |
| Capital Expenditure, % | -8.11 | -9.26 | -9.91 | -6.84 | -7.02 | -8.23 | -8.23 | -8.23 | -8.23 | -8.23 |
| Tax Rate, % | 33.5 | 33.5 | 33.5 | 33.5 | 33.5 | 33.5 | 33.5 | 33.5 | 33.5 | 33.5 |
| EBITAT | 201,352.5 | 233,582.1 | 321,212.6 | 319,417.3 | 352,698.9 | 333,695.7 | 350,330.0 | 367,793.5 | 386,127.5 | 405,375.4 |
| Depreciation | ||||||||||
| Changes in Account Receivables | ||||||||||
| Changes in Inventories | ||||||||||
| Changes in Accounts Payable | ||||||||||
| Capital Expenditure | ||||||||||
| UFCF | -1,394,518.5 | -451,548.9 | -609,507.4 | -208,489.7 | -216,847.1 | 369,345.3 | -132,762.0 | -139,380.0 | -146,327.9 | -153,622.1 |
| WACC, % | 3.96 | 3.98 | 4.08 | 4.01 | 4.02 | 4.01 | 4.01 | 4.01 | 4.01 | 4.01 |
| PV UFCF | ||||||||||
| SUM PV UFCF | -142,706.9 | |||||||||
| Long Term Growth Rate, % | 0.50 | |||||||||
| Free cash flow (T + 1) | -154,390 | |||||||||
| Terminal Value | -4,396,570 | |||||||||
| Present Terminal Value | -3,611,645 | |||||||||
| Enterprise Value | -3,754,351 | |||||||||
| Net Debt | 2,129,048 | |||||||||
| Equity Value | -5,883,399 | |||||||||
| Diluted Shares Outstanding, MM | 632 | |||||||||
| Equity Value Per Share | -9,303.16 |
What You Will Receive
- Pre-Populated Financial Model: Utilizes Daiwa House's actual data for accurate DCF valuation.
- Comprehensive Forecast Control: Modify revenue growth rates, profit margins, WACC, and other essential factors.
- Real-Time Calculations: Automatic updates allow you to view results instantly as adjustments are made.
- Professional-Grade Template: A polished Excel file crafted for high-quality valuation presentations.
- Flexible and Reusable: Designed for customization, enabling consistent use for in-depth forecasts.
Key Features
- Comprehensive DCF Calculator: Features detailed unlevered and levered DCF valuation models tailored for Daiwa House Industry Co., Ltd. (1925T).
- WACC Calculator: A user-friendly Weighted Average Cost of Capital spreadsheet with adjustable parameters.
- Customizable Forecast Assumptions: Easily alter growth rates, capital expenditures, and discount rates.
- Integrated Financial Ratios: Assess profitability, leverage, and efficiency ratios specifically for Daiwa House Industry Co., Ltd. (1925T).
- Interactive Dashboard and Charts: Visual representations that highlight essential valuation metrics for straightforward analysis.
How It Functions
- Download the Template: Gain immediate access to the Excel-based DCF Calculator for Daiwa House Industry Co., Ltd. (1925T).
- Enter Your Assumptions: Modify the yellow-highlighted fields for growth rates, WACC, profit margins, and additional variables.
- Automatic Calculations: The model will instantly refresh to reflect Daiwa House's intrinsic value.
- Explore Scenarios: Experiment with various assumptions to assess potential changes in valuation.
- Evaluate and Decide: Utilize the outcomes to inform your investment or financial analysis.
Why Choose This Calculator for Daiwa House Industry Co., Ltd. (1925T)?
- User-Friendly Interface: Perfectly tailored for both novices and seasoned professionals.
- Customizable Inputs: Easily adjust parameters to suit your financial analysis.
- Real-Time Valuation Updates: Witness immediate changes in Daiwa House's valuation as you modify the inputs.
- Preloaded Financial Data: Comes with Daiwa House's actual financial figures for swift analysis.
- Relied Upon by Industry Experts: A trusted tool for investors and analysts in making well-informed decisions.
Who Can Benefit from This Product?
- Investors: Evaluate Daiwa House Industry Co., Ltd.'s valuation before making stock transactions.
- CFOs and Financial Analysts: Optimize valuation procedures and assess forecasts.
- Startup Founders: Gain insights into how large public firms like Daiwa House are assessed.
- Consultants: Create detailed valuation reports for your clients.
- Students and Educators: Utilize practical data to learn and teach valuation methodologies.
Contents of the Template
- Comprehensive DCF Model: Editable template featuring in-depth valuation calculations.
- Real-World Data: Daiwa House Industry Co., Ltd.'s historical and projected financials preloaded for analysis.
- Customizable Parameters: Modify WACC, growth rates, and tax assumptions to evaluate various scenarios.
- Financial Statements: Complete annual and quarterly breakdowns for enhanced insights.
- Key Ratios: Integrated analysis covering profitability, efficiency, and leverage metrics.
- Dashboard with Visual Outputs: Charts and tables designed for clear, actionable insights.
Disclaimer
All information, articles, and product details provided on this website are for general informational and educational purposes only. We do not claim any ownership over, nor do we intend to infringe upon, any trademarks, copyrights, logos, brand names, or other intellectual property mentioned or depicted on this site. Such intellectual property remains the property of its respective owners, and any references here are made solely for identification or informational purposes, without implying any affiliation, endorsement, or partnership.
We make no representations or warranties, express or implied, regarding the accuracy, completeness, or suitability of any content or products presented. Nothing on this website should be construed as legal, tax, investment, financial, medical, or other professional advice. In addition, no part of this site—including articles or product references—constitutes a solicitation, recommendation, endorsement, advertisement, or offer to buy or sell any securities, franchises, or other financial instruments, particularly in jurisdictions where such activity would be unlawful.
All content is of a general nature and may not address the specific circumstances of any individual or entity. It is not a substitute for professional advice or services. Any actions you take based on the information provided here are strictly at your own risk. You accept full responsibility for any decisions or outcomes arising from your use of this website and agree to release us from any liability in connection with your use of, or reliance upon, the content or products found herein.