
|
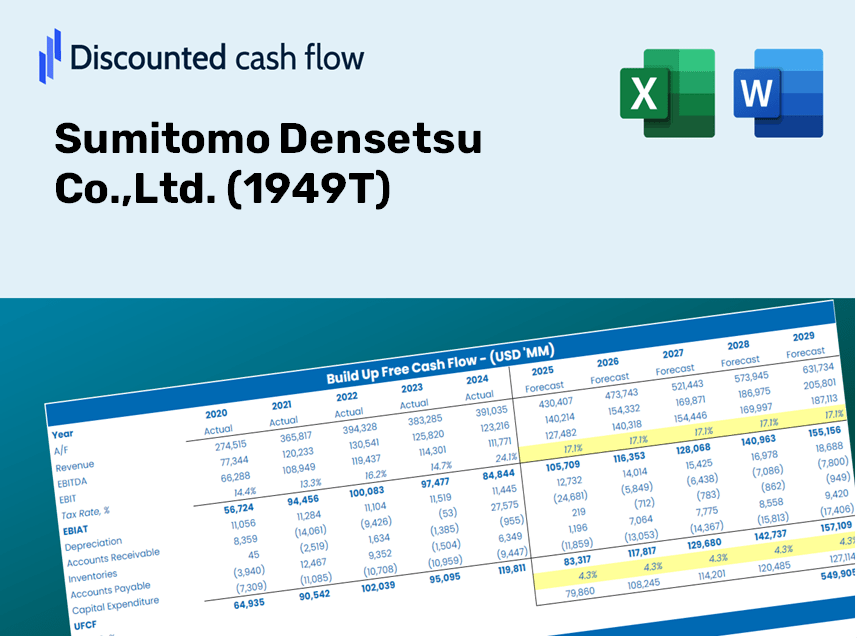
Sumitomo Densetsu Co., Ltd. (1949.T) Avaliação do DCF |
Totalmente Editável: Adapte-Se Às Suas Necessidades No Excel Ou Planilhas
Design Profissional: Modelos Confiáveis E Padrão Da Indústria
Pré-Construídos Para Uso Rápido E Eficiente
Compatível com MAC/PC, totalmente desbloqueado
Não É Necessária Experiência; Fácil De Seguir
Sumitomo Densetsu Co.,Ltd. (1949.T) Bundle
Explore o futuro financeiro da Sumitomo Densetsu Co., Ltd. (1949T) Usando nossa calculadora DCF amigável! Digite suas suposições de crescimento, margens e custos para determinar o valor intrínseco da Sumitomo Densetsu Co., Ltd. (1949T) e aprimore sua estratégia de investimento.
Discounted Cash Flow (DCF) - (USD MM)
| Year | AY1 2020 |
AY2 2021 |
AY3 2022 |
AY4 2023 |
AY5 2024 |
FY1 2025 |
FY2 2026 |
FY3 2027 |
FY4 2028 |
FY5 2029 |
|---|---|---|---|---|---|---|---|---|---|---|
| Revenue | 154,053.0 | 167,594.0 | 175,120.0 | 185,524.0 | 203,639.0 | 218,395.6 | 234,221.5 | 251,194.2 | 269,396.8 | 288,918.5 |
| Revenue Growth, % | 0 | 8.79 | 4.49 | 5.94 | 9.76 | 7.25 | 7.25 | 7.25 | 7.25 | 7.25 |
| EBITDA | 13,058.0 | 15,218.0 | 15,965.0 | 16,102.0 | 20,315.0 | 19,799.0 | 21,233.8 | 22,772.4 | 24,422.6 | 26,192.4 |
| EBITDA, % | 8.48 | 9.08 | 9.12 | 8.68 | 9.98 | 9.07 | 9.07 | 9.07 | 9.07 | 9.07 |
| Depreciation | 1,093.0 | 1,166.0 | 1,248.0 | 1,385.0 | 1,325.0 | 1,535.4 | 1,646.6 | 1,765.9 | 1,893.9 | 2,031.1 |
| Depreciation, % | 0.7095 | 0.69573 | 0.71265 | 0.74653 | 0.65066 | 0.70301 | 0.70301 | 0.70301 | 0.70301 | 0.70301 |
| EBIT | 11,965.0 | 14,052.0 | 14,717.0 | 14,717.0 | 18,990.0 | 18,263.7 | 19,587.1 | 21,006.5 | 22,528.7 | 24,161.3 |
| EBIT, % | 7.77 | 8.38 | 8.4 | 7.93 | 9.33 | 8.36 | 8.36 | 8.36 | 8.36 | 8.36 |
| Total Cash | 39,918.0 | 55,266.0 | 54,770.0 | 59,390.0 | 64,919.0 | 67,289.9 | 72,166.1 | 77,395.5 | 83,003.9 | 89,018.8 |
| Total Cash, percent | .0 | .0 | .0 | .0 | .0 | .0 | .0 | .0 | .0 | .0 |
| Account Receivables | 65,911.0 | 62,329.0 | 64,363.0 | 73,058.0 | 79,817.0 | 85,306.8 | 91,488.5 | 98,118.1 | 105,228.2 | 112,853.5 |
| Account Receivables, % | 42.78 | 37.19 | 36.75 | 39.38 | 39.2 | 39.06 | 39.06 | 39.06 | 39.06 | 39.06 |
| Inventories | 2,638.0 | 3,212.0 | 3,108.0 | 3,085.0 | 3,806.0 | 3,903.0 | 4,185.8 | 4,489.1 | 4,814.4 | 5,163.3 |
| Inventories, % | 1.71 | 1.92 | 1.77 | 1.66 | 1.87 | 1.79 | 1.79 | 1.79 | 1.79 | 1.79 |
| Accounts Payable | 33,833.0 | 30,138.0 | 26,617.0 | 30,062.0 | 41,054.0 | 39,969.9 | 42,866.3 | 45,972.5 | 49,303.9 | 52,876.7 |
| Accounts Payable, % | 21.96 | 17.98 | 15.2 | 16.2 | 20.16 | 18.3 | 18.3 | 18.3 | 18.3 | 18.3 |
| Capital Expenditure | -2,707.0 | -1,800.0 | -2,823.0 | -2,977.0 | -1,772.0 | -3,021.7 | -3,240.7 | -3,475.6 | -3,727.4 | -3,997.5 |
| Capital Expenditure, % | -1.76 | -1.07 | -1.61 | -1.6 | -0.87017 | -1.38 | -1.38 | -1.38 | -1.38 | -1.38 |
| Tax Rate, % | 32.47 | 32.47 | 32.47 | 32.47 | 32.47 | 32.47 | 32.47 | 32.47 | 32.47 | 32.47 |
| EBITAT | 8,066.9 | 9,160.9 | 9,398.7 | 10,080.5 | 12,824.3 | 12,145.5 | 13,025.6 | 13,969.5 | 14,981.8 | 16,067.4 |
| Depreciation | ||||||||||
| Changes in Account Receivables | ||||||||||
| Changes in Inventories | ||||||||||
| Changes in Accounts Payable | ||||||||||
| Capital Expenditure | ||||||||||
| UFCF | -28,263.1 | 7,839.9 | 2,372.7 | 3,261.5 | 15,889.3 | 3,988.2 | 7,863.4 | 8,433.2 | 9,044.3 | 9,699.7 |
| WACC, % | 4.51 | 4.51 | 4.51 | 4.51 | 4.51 | 4.51 | 4.51 | 4.51 | 4.51 | 4.51 |
| PV UFCF | ||||||||||
| SUM PV UFCF | 33,762.6 | |||||||||
| Long Term Growth Rate, % | 0.50 | |||||||||
| Free cash flow (T + 1) | 9,748 | |||||||||
| Terminal Value | 242,998 | |||||||||
| Present Terminal Value | 194,885 | |||||||||
| Enterprise Value | 228,648 | |||||||||
| Net Debt | -62,386 | |||||||||
| Equity Value | 291,034 | |||||||||
| Diluted Shares Outstanding, MM | 35 | |||||||||
| Equity Value Per Share | 8,265.02 |
What You Will Receive
- Authentic Sumitomo Densetsu Data: Preloaded financials – including revenue and EBIT – derived from actual and forecasted figures.
- Comprehensive Customization: Modify essential parameters (yellow cells) such as WACC, growth %, and tax rates.
- Immediate Valuation Updates: Automatic recalculations to assess the effects of changes on Sumitomo Densetsu’s fair value.
- Flexible Excel Template: Designed for quick adjustments, scenario analysis, and in-depth projections.
- Efficient and Precise: Eliminate the need to construct models from the ground up while ensuring accuracy and adaptability.
Key Features
- Comprehensive DCF Calculator: Features detailed unlevered and levered DCF valuation models tailored for Sumitomo Densetsu Co., Ltd. (1949T).
- WACC Calculator: Comes with a pre-configured Weighted Average Cost of Capital sheet that allows for customizable inputs.
- Adjustable Forecast Assumptions: Easily modify growth projections, capital expenditures, and discount rates.
- Integrated Financial Ratios: Evaluate profitability, leverage, and efficiency ratios specifically for Sumitomo Densetsu Co., Ltd. (1949T).
- User-Friendly Dashboard and Charts: Visual displays present key valuation metrics for straightforward analysis.
How It Works
- Step 1: Download the Excel file.
- Step 2: Examine the pre-filled Sumitomo Densetsu data (both historical and forecasted).
- Step 3: Modify the key assumptions (indicated in yellow cells) according to your analysis.
- Step 4: Observe the automatic updates for Sumitomo Densetsu’s intrinsic value.
- Step 5: Utilize the results for investment decisions or reporting purposes.
Why Choose Sumitomo Densetsu Co.,Ltd. (1949T)?
- Time-Saving: Skip the hassle of building a valuation model from the ground up; our tools are immediately accessible.
- Enhanced Precision: Utilize accurate financial data and formulas to minimize valuation errors.
- Fully Customizable: Adapt the model to suit your unique assumptions and forecasts.
- User-Friendly: Intuitive charts and outputs simplify data analysis and interpretation.
- Expert-Approved: Crafted for professionals who prioritize accuracy and ease of use.
Who Can Benefit from This Product?
- Individual Investors: Make educated decisions about buying or selling shares of Sumitomo Densetsu Co., Ltd. (1949T).
- Financial Analysts: Enhance valuation processes with pre-built financial models tailored for Sumitomo Densetsu Co., Ltd. (1949T).
- Consultants: Provide clients with precise valuation insights on Sumitomo Densetsu Co., Ltd. (1949T) in a timely manner.
- Business Owners: Gain insights into how major companies like Sumitomo Densetsu Co., Ltd. (1949T) are valued to inform your own business strategies.
- Finance Students: Master valuation techniques through the analysis of real-world data and scenarios involving Sumitomo Densetsu Co., Ltd. (1949T).
What the Template Contains
- Operating and Balance Sheet Data: Pre-filled Sumitomo Densetsu Co., Ltd. (1949T) historical data and forecasts, including revenue, EBITDA, EBIT, and capital expenditures.
- WACC Calculation: A dedicated sheet for Weighted Average Cost of Capital (WACC), featuring parameters such as Beta, risk-free rate, and share price.
- DCF Valuation (Unlevered and Levered): Editable Discounted Cash Flow models that illustrate intrinsic value with comprehensive calculations.
- Financial Statements: Pre-loaded financial statements (annual and quarterly) to facilitate analysis.
- Key Ratios: Includes profitability, leverage, and efficiency ratios for Sumitomo Densetsu Co., Ltd. (1949T).
- Dashboard and Charts: Visual summary of valuation outputs and assumptions for easy analysis of results.
Disclaimer
All information, articles, and product details provided on this website are for general informational and educational purposes only. We do not claim any ownership over, nor do we intend to infringe upon, any trademarks, copyrights, logos, brand names, or other intellectual property mentioned or depicted on this site. Such intellectual property remains the property of its respective owners, and any references here are made solely for identification or informational purposes, without implying any affiliation, endorsement, or partnership.
We make no representations or warranties, express or implied, regarding the accuracy, completeness, or suitability of any content or products presented. Nothing on this website should be construed as legal, tax, investment, financial, medical, or other professional advice. In addition, no part of this site—including articles or product references—constitutes a solicitation, recommendation, endorsement, advertisement, or offer to buy or sell any securities, franchises, or other financial instruments, particularly in jurisdictions where such activity would be unlawful.
All content is of a general nature and may not address the specific circumstances of any individual or entity. It is not a substitute for professional advice or services. Any actions you take based on the information provided here are strictly at your own risk. You accept full responsibility for any decisions or outcomes arising from your use of this website and agree to release us from any liability in connection with your use of, or reliance upon, the content or products found herein.