
|
Avaliação DCF do Everest Medicines Limited (1952.HK) |
Totalmente Editável: Adapte-Se Às Suas Necessidades No Excel Ou Planilhas
Design Profissional: Modelos Confiáveis E Padrão Da Indústria
Pré-Construídos Para Uso Rápido E Eficiente
Compatível com MAC/PC, totalmente desbloqueado
Não É Necessária Experiência; Fácil De Seguir
Everest Medicines Limited (1952.HK) Bundle
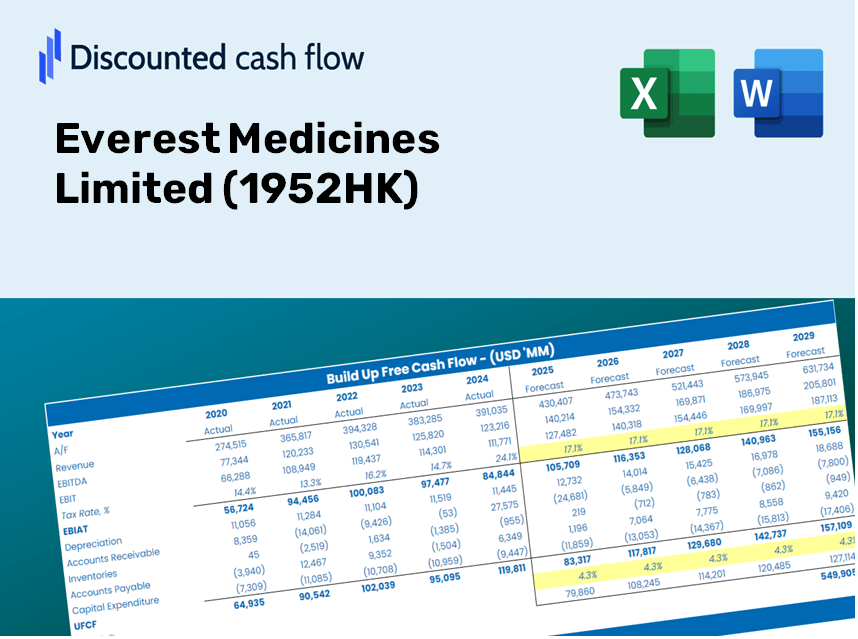
Explore as perspectivas financeiras da Everest Medicines Limited (1952HK) com nossa calculadora DCF amigável! Digite suas projeções de crescimento, margens e despesas para determinar o valor intrínseco do Everest Medicines Limited (1952HK) e moldar sua abordagem de investimento.
Discounted Cash Flow (DCF) - (USD MM)
| Year | AY1 2020 |
AY2 2021 |
AY3 2022 |
AY4 2023 |
AY5 2024 |
FY1 2025 |
FY2 2026 |
FY3 2027 |
FY4 2028 |
FY5 2029 |
|---|---|---|---|---|---|---|---|---|---|---|
| Revenue | .0 | .1 | 14.0 | 137.7 | 772.7 | 1,352.2 | 2,366.3 | 4,141.1 | 7,246.9 | 12,682.1 |
| Revenue Growth, % | 0 | 0 | 23588.89 | 884.46 | 461.16 | 75 | 75 | 75 | 75 | 75 |
| EBITDA | -746.8 | -1,063.6 | -217.5 | -814.2 | -732.6 | -797.3 | -1,395.3 | -2,441.7 | -4,273.0 | -7,477.8 |
| EBITDA, % | 100 | -1801442.59 | -1554.97 | -591.29 | -94.82 | -58.96 | -58.96 | -58.96 | -58.96 | -58.96 |
| Depreciation | 4.9 | 34.0 | 46.8 | 83.9 | 120.5 | 1,018.4 | 1,782.1 | 3,118.7 | 5,457.7 | 9,551.0 |
| Depreciation, % | 100 | 57637.04 | 334.37 | 60.97 | 15.59 | 75.31 | 75.31 | 75.31 | 75.31 | 75.31 |
| EBIT | -751.7 | -1,097.7 | -264.3 | -898.1 | -853.1 | -811.3 | -1,419.8 | -2,484.7 | -4,348.1 | -7,609.2 |
| EBIT, % | 100 | -1859079.63 | -1889.34 | -652.26 | -110.41 | -60 | -60 | -60 | -60 | -60 |
| Total Cash | 4,899.7 | 2,886.6 | 1,805.6 | 2,569.1 | 1,753.1 | 1,352.2 | 2,366.3 | 4,141.1 | 7,246.9 | 12,682.1 |
| Total Cash, percent | .0 | 4.9 | .0 | .0 | .0 | .0 | .0 | .0 | .0 | .0 |
| Account Receivables | .0 | .1 | 5.7 | 54.5 | 398.8 | 872.7 | 1,527.2 | 2,672.7 | 4,677.2 | 8,185.0 |
| Account Receivables, % | 100 | 90.74 | 40.76 | 39.59 | 51.61 | 64.54 | 64.54 | 64.54 | 64.54 | 64.54 |
| Inventories | .0 | .5 | 12.7 | 20.7 | 15.4 | 833.0 | 1,457.7 | 2,551.0 | 4,464.2 | 7,812.3 |
| Inventories, % | 100 | 827.78 | 90.97 | 15.04 | 1.99 | 61.6 | 61.6 | 61.6 | 61.6 | 61.6 |
| Accounts Payable | 82.1 | 93.7 | 117.6 | 53.5 | 50.4 | 934.0 | 1,634.4 | 2,860.2 | 5,005.4 | 8,759.5 |
| Accounts Payable, % | 100 | 158625.93 | 840.53 | 38.82 | 6.53 | 69.07 | 69.07 | 69.07 | 69.07 | 69.07 |
| Capital Expenditure | -568.5 | -1,067.0 | -473.2 | -290.8 | -71.5 | -836.3 | -1,463.6 | -2,561.3 | -4,482.3 | -7,844.0 |
| Capital Expenditure, % | 100 | -1807066.67 | -3382.92 | -211.19 | -9.26 | -61.85 | -61.85 | -61.85 | -61.85 | -61.85 |
| Tax Rate, % | 0 | 0 | 0 | 0 | 0 | 0 | 0 | 0 | 0 | 0 |
| EBITAT | -754.9 | -1,097.7 | -264.3 | -898.1 | -853.1 | -811.3 | -1,419.8 | -2,484.7 | -4,348.1 | -7,609.2 |
| Depreciation | ||||||||||
| Changes in Account Receivables | ||||||||||
| Changes in Inventories | ||||||||||
| Changes in Accounts Payable | ||||||||||
| Capital Expenditure | ||||||||||
| UFCF | -1,236.4 | -2,119.6 | -684.6 | -1,225.9 | -1,146.1 | -1,037.3 | -1,680.1 | -2,940.1 | -5,145.2 | -9,004.2 |
| WACC, % | 12.12 | 12.12 | 12.12 | 12.12 | 12.12 | 12.12 | 12.12 | 12.12 | 12.12 | 12.12 |
| PV UFCF | ||||||||||
| SUM PV UFCF | -12,685.9 | |||||||||
| Long Term Growth Rate, % | 2.00 | |||||||||
| Free cash flow (T + 1) | -9,184 | |||||||||
| Terminal Value | -90,762 | |||||||||
| Present Terminal Value | -51,228 | |||||||||
| Enterprise Value | -63,914 | |||||||||
| Net Debt | -338 | |||||||||
| Equity Value | -63,576 | |||||||||
| Diluted Shares Outstanding, MM | 321 | |||||||||
| Equity Value Per Share | -198.11 |
Your Benefits
- Customizable Excel Template: An adaptable Excel-based DCF Calculator featuring pre-filled financial data for Everest Medicines Limited (1952HK).
- Accurate Financial Data: Access to historical figures and forward-looking estimates (highlighted in the yellow cells).
- Flexible Forecasting: Adjust key assumptions such as revenue growth, EBITDA %, and WACC as needed.
- Real-Time Calculations: Effortlessly observe how your inputs influence the valuation of Everest Medicines Limited (1952HK).
- Professional Grade Tool: Designed specifically for investors, CFOs, consultants, and financial analysts.
- Intuitive Layout: Organized for ease of navigation and comprehension, complete with step-by-step guidance.
Key Features
- Real-Life 1952HK Data: Pre-loaded with Everest Medicines Limited's historical financials and future projections.
- Fully Customizable Inputs: Modify revenue growth, profit margins, WACC, tax rates, and capital expenditures as needed.
- Dynamic Valuation Model: Automatically refreshes Net Present Value (NPV) and intrinsic value based on your adjustments.
- Scenario Testing: Develop various forecast scenarios to explore different valuation possibilities.
- User-Friendly Design: Intuitive and organized, suitable for both professionals and newcomers.
How It Works
- Download: Obtain the pre-prepared Excel file containing Everest Medicines Limited's (1952HK) financial data.
- Customize: Modify key forecasts such as revenue growth, EBITDA %, and WACC as needed.
- Update Instantly: The intrinsic value and NPV calculations refresh automatically in real-time.
- Test Scenarios: Develop various projections and compare results without delay.
- Make Informed Decisions: Utilize the valuation insights to steer your investment approach.
Why Opt for This Calculator?
- Precise Information: Utilize actual Everest Medicines Limited (1952HK) financial data for trustworthy valuation outcomes.
- Flexible Parameters: Modify essential metrics such as growth rates, WACC, and tax rates to align with your forecasts.
- Efficient: Built-in calculations save you the hassle of starting from the ground up.
- Professional Quality: Tailored for investors, analysts, and consultants in the industry.
- User Intuitive: Simple design and guided steps ensure ease of use for everyone.
Who Can Benefit from This Product?
- Investors: Precisely assess the fair value of Everest Medicines Limited (1952HK) prior to making investment choices.
- CFOs: Utilize a high-quality DCF model for enhanced financial reporting and analysis.
- Consultants: Efficiently modify the template for client valuation reports.
- Entrepreneurs: Acquire knowledge on financial modeling practices employed by leading firms.
- Educators: Employ it as a resource to illustrate valuation techniques in the classroom.
Contents of the Template
- Historical Data: Comprises Everest Medicines Limited's (1952HK) previous financials and baseline forecasts.
- DCF and Levered DCF Models: Comprehensive templates designed to calculate the intrinsic value of Everest Medicines Limited (1952HK).
- WACC Sheet: Pre-constructed calculations for the Weighted Average Cost of Capital.
- Editable Inputs: Adjust critical drivers such as growth rates, EBITDA %, and CAPEX assumptions.
- Quarterly and Annual Statements: An extensive overview of Everest Medicines Limited's (1952HK) financials.
- Interactive Dashboard: Dynamically visualize valuation results and projections.
Disclaimer
All information, articles, and product details provided on this website are for general informational and educational purposes only. We do not claim any ownership over, nor do we intend to infringe upon, any trademarks, copyrights, logos, brand names, or other intellectual property mentioned or depicted on this site. Such intellectual property remains the property of its respective owners, and any references here are made solely for identification or informational purposes, without implying any affiliation, endorsement, or partnership.
We make no representations or warranties, express or implied, regarding the accuracy, completeness, or suitability of any content or products presented. Nothing on this website should be construed as legal, tax, investment, financial, medical, or other professional advice. In addition, no part of this site—including articles or product references—constitutes a solicitation, recommendation, endorsement, advertisement, or offer to buy or sell any securities, franchises, or other financial instruments, particularly in jurisdictions where such activity would be unlawful.
All content is of a general nature and may not address the specific circumstances of any individual or entity. It is not a substitute for professional advice or services. Any actions you take based on the information provided here are strictly at your own risk. You accept full responsibility for any decisions or outcomes arising from your use of this website and agree to release us from any liability in connection with your use of, or reliance upon, the content or products found herein.