
|
Bank of Chongqing Co., Ltd. (1963.HK) Avaliação DCF |
Totalmente Editável: Adapte-Se Às Suas Necessidades No Excel Ou Planilhas
Design Profissional: Modelos Confiáveis E Padrão Da Indústria
Pré-Construídos Para Uso Rápido E Eficiente
Compatível com MAC/PC, totalmente desbloqueado
Não É Necessária Experiência; Fácil De Seguir
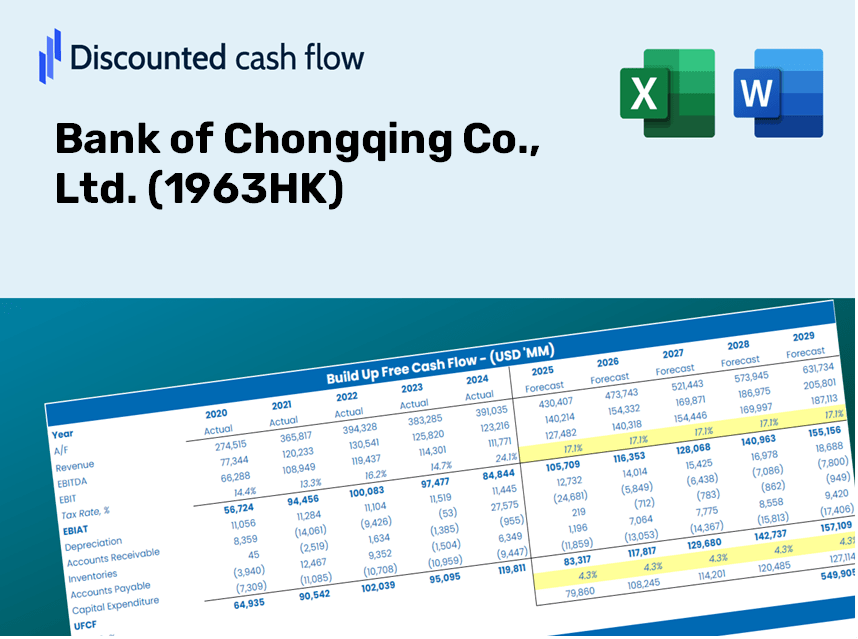
Bank of Chongqing Co., Ltd. (1963.HK) Bundle
Otimize seu tempo e aumente a precisão com a nossa calculadora DCF (1963HK)! Utilizando dados reais do Bank of Chongqing Co., Ltd. e suposições personalizáveis, essa ferramenta capacita você a prever, analisar e valorizar o Bank of Chongqing Co., Ltd., como um investidor experiente.
Discounted Cash Flow (DCF) - (USD MM)
| Year | AY1 2020 |
AY2 2021 |
AY3 2022 |
AY4 2023 |
AY5 2024 |
FY1 2025 |
FY2 2026 |
FY3 2027 |
FY4 2028 |
FY5 2029 |
|---|---|---|---|---|---|---|---|---|---|---|
| Revenue | 9,397.7 | 10,231.5 | 10,503.5 | 10,523.3 | 35,235.6 | 45,076.9 | 57,666.8 | 73,773.2 | 94,378.0 | 120,737.8 |
| Revenue Growth, % | 0 | 8.87 | 2.66 | 0.18851 | 234.83 | 27.93 | 27.93 | 27.93 | 27.93 | 27.93 |
| EBITDA | .0 | 7,057.2 | 7,336.6 | .0 | 7,564.8 | 14,451.1 | 18,487.2 | 23,650.7 | 30,256.4 | 38,707.0 |
| EBITDA, % | 0 | 68.98 | 69.85 | 0 | 21.47 | 32.06 | 32.06 | 32.06 | 32.06 | 32.06 |
| Depreciation | 346.2 | 380.9 | 444.6 | 485.2 | 557.7 | 1,607.8 | 2,056.8 | 2,631.3 | 3,366.2 | 4,306.4 |
| Depreciation, % | 3.68 | 3.72 | 4.23 | 4.61 | 1.58 | 3.57 | 3.57 | 3.57 | 3.57 | 3.57 |
| EBIT | -346.2 | 6,676.3 | 6,892.0 | -485.2 | 7,007.0 | 12,843.3 | 16,430.4 | 21,019.4 | 26,890.2 | 34,400.6 |
| EBIT, % | -3.68 | 65.25 | 65.62 | -4.61 | 19.89 | 28.49 | 28.49 | 28.49 | 28.49 | 28.49 |
| Total Cash | 46,299.0 | 48,645.8 | 53,170.0 | 61,079.9 | 69,479.8 | 45,076.9 | 57,666.8 | 73,773.2 | 94,378.0 | 120,737.8 |
| Total Cash, percent | .0 | .0 | .0 | .0 | .0 | .0 | .0 | .0 | .0 | .0 |
| Account Receivables | 29,340.1 | 38,211.9 | 59,492.7 | 8,905.6 | 8,128.9 | 36,755.5 | 47,021.3 | 60,154.3 | 76,955.4 | 98,449.0 |
| Account Receivables, % | 312.21 | 373.47 | 566.41 | 84.63 | 23.07 | 81.54 | 81.54 | 81.54 | 81.54 | 81.54 |
| Inventories | .0 | .0 | .0 | .0 | .0 | .0 | .0 | .0 | .0 | .0 |
| Inventories, % | 0 | 0 | 0 | 0 | 0 | 0 | 0 | 0 | 0 | 0 |
| Accounts Payable | 3,906.6 | 4,613.0 | 6,673.5 | 10,093.3 | 14,943.9 | 26,011.0 | 33,275.9 | 42,569.8 | 54,459.5 | 69,670.1 |
| Accounts Payable, % | 41.57 | 45.09 | 63.54 | 95.91 | 42.41 | 57.7 | 57.7 | 57.7 | 57.7 | 57.7 |
| Capital Expenditure | -487.5 | -383.2 | -370.4 | -455.3 | -734.8 | -1,701.3 | -2,176.5 | -2,784.4 | -3,562.1 | -4,557.0 |
| Capital Expenditure, % | -5.19 | -3.75 | -3.53 | -4.33 | -2.09 | -3.77 | -3.77 | -3.77 | -3.77 | -3.77 |
| Tax Rate, % | 19.97 | 19.97 | 19.97 | 19.97 | 19.97 | 19.97 | 19.97 | 19.97 | 19.97 | 19.97 |
| EBITAT | -267.1 | 5,111.0 | 5,334.6 | -392.9 | 5,608.0 | 10,072.2 | 12,885.4 | 16,484.3 | 21,088.4 | 26,978.4 |
| Depreciation | ||||||||||
| Changes in Account Receivables | ||||||||||
| Changes in Inventories | ||||||||||
| Changes in Accounts Payable | ||||||||||
| Capital Expenditure | ||||||||||
| UFCF | -25,841.9 | -3,056.7 | -13,811.5 | 53,643.8 | 11,058.2 | -7,580.8 | 9,764.8 | 12,492.1 | 15,981.1 | 20,444.6 |
| WACC, % | 7.08 | 7.04 | 7.11 | 7.39 | 7.31 | 7.19 | 7.19 | 7.19 | 7.19 | 7.19 |
| PV UFCF | ||||||||||
| SUM PV UFCF | 38,128.4 | |||||||||
| Long Term Growth Rate, % | 2.00 | |||||||||
| Free cash flow (T + 1) | 20,854 | |||||||||
| Terminal Value | 402,067 | |||||||||
| Present Terminal Value | 284,182 | |||||||||
| Enterprise Value | 322,310 | |||||||||
| Net Debt | 144,211 | |||||||||
| Equity Value | 178,099 | |||||||||
| Diluted Shares Outstanding, MM | 4,763 | |||||||||
| Equity Value Per Share | 37.39 |
What You Will Receive
- Authentic 1963HK Financials: Provides both historical and projected data for precise valuation.
- Customizable Inputs: Adjust WACC, tax rates, revenue growth, and capital expenditures as needed.
- Dynamic Calculations: Get real-time calculations for intrinsic value and NPV.
- Scenario Analysis: Explore various scenarios to assess the future outlook of Bank of Chongqing.
- User-Friendly Design: Designed for professionals while remaining accessible to newcomers.
Key Features
- Pre-Loaded Data: Historical financial statements and pre-filled forecasts for Bank of Chongqing Co., Ltd. (1963HK).
- Fully Adjustable Inputs: Customize WACC, tax rates, revenue growth, and EBITDA margins as needed.
- Instant Results: View the intrinsic value of Bank of Chongqing Co., Ltd. (1963HK) recalculating in real time.
- Clear Visual Outputs: Dashboard charts present valuation results and essential metrics clearly.
- Built for Accuracy: A professional-grade tool designed for analysts, investors, and finance professionals.
How It Works
- Step 1: Download the Excel spreadsheet.
- Step 2: Examine the pre-filled Bank of Chongqing data (historical and projected).
- Step 3: Modify key assumptions (highlighted in yellow) according to your findings.
- Step 4: Check automatic recalculations for Bank of Chongqing's intrinsic value.
- Step 5: Utilize the results for investment analysis or reporting needs.
Why Choose the Bank of Chongqing Co., Ltd. (1963HK) Calculator?
- Time Efficiency: Skip the hassle of building a DCF model from the ground up – it's readily available for your use.
- Enhanced Precision: Dependable financial data and formulas help minimize valuation errors.
- Completely Customizable: Adjust the model to align with your specific assumptions and forecasts.
- User-Friendly: Intuitive charts and outputs simplify the analysis of results.
- Preferred by Professionals: Crafted for experts who prioritize accuracy and ease of use.
Who Can Benefit from This Product?
- Investors: Evaluate Bank of Chongqing Co., Ltd.'s (1963HK) performance before making investment decisions.
- CFOs and Financial Analysts: Enhance valuation workflows and validate financial forecasts.
- Startup Founders: Discover valuation methodologies employed by established banks like Bank of Chongqing Co., Ltd. (1963HK).
- Consultants: Provide clients with detailed and professional valuation assessments.
- Students and Educators: Utilize real-time data to learn and teach valuation strategies.
Contents of the Template
- Pre-Filled Data: Features historical financial information and forecasts for Bank of Chongqing Co., Ltd. (1963HK).
- Discounted Cash Flow Model: An editable DCF valuation model with automatic calculations.
- Weighted Average Cost of Capital (WACC): A dedicated worksheet for calculating WACC based on your custom inputs.
- Key Financial Ratios: Assess Bank of Chongqing's profitability, efficiency, and leverage.
- Customizable Inputs: Easily modify revenue growth, margins, and tax rates.
- Clear Dashboard: Visual summaries comprising charts and tables of essential valuation results.
Disclaimer
All information, articles, and product details provided on this website are for general informational and educational purposes only. We do not claim any ownership over, nor do we intend to infringe upon, any trademarks, copyrights, logos, brand names, or other intellectual property mentioned or depicted on this site. Such intellectual property remains the property of its respective owners, and any references here are made solely for identification or informational purposes, without implying any affiliation, endorsement, or partnership.
We make no representations or warranties, express or implied, regarding the accuracy, completeness, or suitability of any content or products presented. Nothing on this website should be construed as legal, tax, investment, financial, medical, or other professional advice. In addition, no part of this site—including articles or product references—constitutes a solicitation, recommendation, endorsement, advertisement, or offer to buy or sell any securities, franchises, or other financial instruments, particularly in jurisdictions where such activity would be unlawful.
All content is of a general nature and may not address the specific circumstances of any individual or entity. It is not a substitute for professional advice or services. Any actions you take based on the information provided here are strictly at your own risk. You accept full responsibility for any decisions or outcomes arising from your use of this website and agree to release us from any liability in connection with your use of, or reliance upon, the content or products found herein.