
|
Takasago Thermal Engineering Co., Ltd. (1969.T) DCF Avaliação |
Totalmente Editável: Adapte-Se Às Suas Necessidades No Excel Ou Planilhas
Design Profissional: Modelos Confiáveis E Padrão Da Indústria
Pré-Construídos Para Uso Rápido E Eficiente
Compatível com MAC/PC, totalmente desbloqueado
Não É Necessária Experiência; Fácil De Seguir
Takasago Thermal Engineering Co., Ltd. (1969.T) Bundle
Descubra o verdadeiro potencial da Takasago Thermal Engineering Co., Ltd. (1969T) com nossa calculadora DCF avançada! Ajuste as principais suposições, explore vários cenários e avalie como diferentes fatores influenciam a avaliação da Takasago Thermal Engineering Co., Ltd. (1969T) - tudo dentro de um modelo abrangente do Excel.
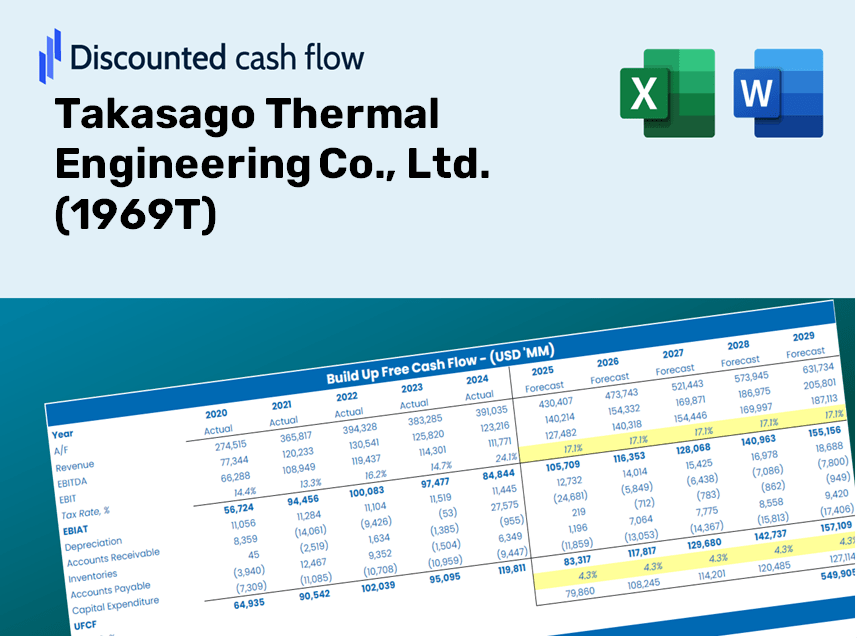
Discounted Cash Flow (DCF) - (USD MM)
| Year | AY1 2020 |
AY2 2021 |
AY3 2022 |
AY4 2023 |
AY5 2024 |
FY1 2025 |
FY2 2026 |
FY3 2027 |
FY4 2028 |
FY5 2029 |
|---|---|---|---|---|---|---|---|---|---|---|
| Revenue | 275,181.0 | 302,746.0 | 338,831.0 | 363,366.0 | 381,661.0 | 414,304.7 | 449,740.4 | 488,206.9 | 529,963.5 | 575,291.6 |
| Revenue Growth, % | 0 | 10.02 | 11.92 | 7.24 | 5.03 | 8.55 | 8.55 | 8.55 | 8.55 | 8.55 |
| EBITDA | 16,611.0 | 18,904.0 | 19,611.0 | 30,072.0 | 41,070.0 | 30,745.7 | 33,375.4 | 36,230.1 | 39,328.8 | 42,692.6 |
| EBITDA, % | 6.04 | 6.24 | 5.79 | 8.28 | 10.76 | 7.42 | 7.42 | 7.42 | 7.42 | 7.42 |
| Depreciation | 1,725.0 | 1,941.0 | 2,481.0 | 2,732.0 | 3,292.0 | 2,995.1 | 3,251.3 | 3,529.4 | 3,831.2 | 4,158.9 |
| Depreciation, % | 0.62686 | 0.64113 | 0.73222 | 0.75186 | 0.86255 | 0.72292 | 0.72292 | 0.72292 | 0.72292 | 0.72292 |
| EBIT | 14,886.0 | 16,963.0 | 17,130.0 | 27,340.0 | 37,778.0 | 27,750.6 | 30,124.2 | 32,700.7 | 35,497.6 | 38,533.7 |
| EBIT, % | 5.41 | 5.6 | 5.06 | 7.52 | 9.9 | 6.7 | 6.7 | 6.7 | 6.7 | 6.7 |
| Total Cash | 64,127.0 | 56,960.0 | 72,317.0 | 53,298.0 | 47,647.0 | 75,082.8 | 81,504.7 | 88,475.9 | 96,043.3 | 104,257.9 |
| Total Cash, percent | .0 | .0 | .0 | .0 | .0 | .0 | .0 | .0 | .0 | .0 |
| Account Receivables | 120,616.0 | 158,636.0 | 147,880.0 | 185,660.0 | 185,841.0 | 198,586.1 | 215,571.3 | 234,009.2 | 254,024.1 | 275,751.0 |
| Account Receivables, % | 43.83 | 52.4 | 43.64 | 51.09 | 48.69 | 47.93 | 47.93 | 47.93 | 47.93 | 47.93 |
| Inventories | 4,433.0 | 3,229.0 | 3,330.0 | 4,057.0 | 3,889.0 | 4,802.4 | 5,213.2 | 5,659.1 | 6,143.1 | 6,668.5 |
| Inventories, % | 1.61 | 1.07 | 0.98279 | 1.12 | 1.02 | 1.16 | 1.16 | 1.16 | 1.16 | 1.16 |
| Accounts Payable | 54,333.0 | 65,049.0 | 64,252.0 | 58,253.0 | 49,713.0 | 73,953.8 | 80,279.2 | 87,145.5 | 94,599.1 | 102,690.2 |
| Accounts Payable, % | 19.74 | 21.49 | 18.96 | 16.03 | 13.03 | 17.85 | 17.85 | 17.85 | 17.85 | 17.85 |
| Capital Expenditure | -4,637.0 | -3,011.0 | -5,048.0 | -3,347.0 | -4,337.0 | -5,159.7 | -5,601.0 | -6,080.1 | -6,600.1 | -7,164.6 |
| Capital Expenditure, % | -1.69 | -0.99456 | -1.49 | -0.92111 | -1.14 | -1.25 | -1.25 | -1.25 | -1.25 | -1.25 |
| Tax Rate, % | 26.33 | 26.33 | 26.33 | 26.33 | 26.33 | 26.33 | 26.33 | 26.33 | 26.33 | 26.33 |
| EBITAT | 10,302.9 | 11,698.4 | 12,428.7 | 19,820.1 | 27,830.9 | 19,808.2 | 21,502.4 | 23,341.5 | 25,337.9 | 27,505.1 |
| Depreciation | ||||||||||
| Changes in Account Receivables | ||||||||||
| Changes in Inventories | ||||||||||
| Changes in Accounts Payable | ||||||||||
| Capital Expenditure | ||||||||||
| UFCF | -63,325.1 | -15,471.6 | 19,719.7 | -25,300.9 | 18,232.9 | 28,225.9 | 8,082.0 | 8,773.3 | 9,523.7 | 10,338.2 |
| WACC, % | 6.91 | 6.91 | 6.92 | 6.92 | 6.92 | 6.92 | 6.92 | 6.92 | 6.92 | 6.92 |
| PV UFCF | ||||||||||
| SUM PV UFCF | 55,337.8 | |||||||||
| Long Term Growth Rate, % | 3.00 | |||||||||
| Free cash flow (T + 1) | 10,648 | |||||||||
| Terminal Value | 271,949 | |||||||||
| Present Terminal Value | 194,662 | |||||||||
| Enterprise Value | 250,000 | |||||||||
| Net Debt | -9,910 | |||||||||
| Equity Value | 259,910 | |||||||||
| Diluted Shares Outstanding, MM | 133 | |||||||||
| Equity Value Per Share | 1,957.24 |
What You'll Receive
- Genuine 1969T Financial Data: Pre-populated with Takasago Thermal Engineering's historical and forecasted data for accurate analysis.
- Completely Customizable Template: Easily adjust essential inputs such as revenue growth, WACC, and EBITDA percentages.
- Instant Calculations: Watch the intrinsic value of Takasago Thermal Engineering update in real-time as you make changes.
- Expert Valuation Tool: Crafted for investors, analysts, and consultants aiming for precise DCF outcomes.
- Intuitive Design: A clear layout and straightforward instructions suitable for all skill levels.
Key Features
- Comprehensive DCF Calculator: Features detailed unlevered and levered DCF valuation models tailored for Takasago Thermal Engineering Co., Ltd. (1969T).
- WACC Calculator: Pre-structured Weighted Average Cost of Capital sheet with adjustable inputs for precise analysis.
- Customizable Forecast Assumptions: Adjust growth rates, capital expenditures, and discount rates to reflect your projections.
- Integrated Financial Ratios: Evaluate profitability, leverage, and efficiency ratios specifically for Takasago Thermal Engineering Co., Ltd. (1969T).
- Visual Dashboard and Charts: Interactive outputs present key valuation metrics for straightforward evaluation.
How It Works
- Step 1: Download the prebuilt Excel template featuring Takasago Thermal Engineering Co., Ltd.'s (1969T) data.
- Step 2: Review the pre-filled sheets to familiarize yourself with the essential metrics.
- Step 3: Modify forecasts and assumptions in the editable yellow cells (WACC, growth, margins).
- Step 4: Instantly see the recalculated results, including the intrinsic value of Takasago Thermal Engineering Co., Ltd. (1969T).
- Step 5: Utilize the outputs to make informed investment decisions or create detailed reports.
Why Opt for Takasago's Calculator?
- All-in-One Solution: Integrates DCF, WACC, and various financial ratio analyses for comprehensive evaluations.
- Flexible Inputs: Modify the yellow-highlighted cells to explore different scenarios tailored to your needs.
- In-Depth Analysis: Automatically computes Takasago's intrinsic value and Net Present Value for informed decision-making.
- Ready-to-Use Data: Comes with historical and projected data to establish accurate benchmarks.
- High-Quality Standards: Designed for financial analysts, investors, and business consultants seeking professional-grade tools.
Who Should Utilize This Product?
- Institutional Investors: Develop comprehensive and accurate valuation models for assessing investment opportunities in Takasago Thermal Engineering Co., Ltd. (1969T).
- Corporate Finance Professionals: Evaluate valuation scenarios to inform strategic decisions within their organizations.
- Consultants and Financial Advisors: Deliver precise valuation insights to clients interested in Takasago Thermal Engineering Co., Ltd. (1969T).
- Students and Instructors: Leverage real-world data to enhance learning and practice in financial modeling.
- Industry Enthusiasts: Gain a deeper understanding of how thermal engineering companies like Takasago are valued in the marketplace.
Contents of the Template
- Preloaded TKSG Data: Historical and projected financial metrics, including revenue, EBIT, and capital expenditures.
- DCF and WACC Models: Advanced spreadsheets designed for calculating intrinsic value and Weighted Average Cost of Capital.
- Customizable Inputs: Yellow-highlighted cells that allow adjustments for revenue growth, tax rates, and discount rates.
- Financial Statements: Detailed annual and quarterly financial reports for thorough analysis.
- Key Ratios: Profitability, leverage, and efficiency ratios for assessing performance.
- Dashboard and Charts: Visual representations of valuation results and underlying assumptions.
Disclaimer
All information, articles, and product details provided on this website are for general informational and educational purposes only. We do not claim any ownership over, nor do we intend to infringe upon, any trademarks, copyrights, logos, brand names, or other intellectual property mentioned or depicted on this site. Such intellectual property remains the property of its respective owners, and any references here are made solely for identification or informational purposes, without implying any affiliation, endorsement, or partnership.
We make no representations or warranties, express or implied, regarding the accuracy, completeness, or suitability of any content or products presented. Nothing on this website should be construed as legal, tax, investment, financial, medical, or other professional advice. In addition, no part of this site—including articles or product references—constitutes a solicitation, recommendation, endorsement, advertisement, or offer to buy or sell any securities, franchises, or other financial instruments, particularly in jurisdictions where such activity would be unlawful.
All content is of a general nature and may not address the specific circumstances of any individual or entity. It is not a substitute for professional advice or services. Any actions you take based on the information provided here are strictly at your own risk. You accept full responsibility for any decisions or outcomes arising from your use of this website and agree to release us from any liability in connection with your use of, or reliance upon, the content or products found herein.