
|
Man Wah Holdings Limited (1999.HK) Avaliação DCF |
Totalmente Editável: Adapte-Se Às Suas Necessidades No Excel Ou Planilhas
Design Profissional: Modelos Confiáveis E Padrão Da Indústria
Pré-Construídos Para Uso Rápido E Eficiente
Compatível com MAC/PC, totalmente desbloqueado
Não É Necessária Experiência; Fácil De Seguir
Man Wah Holdings Limited (1999.HK) Bundle
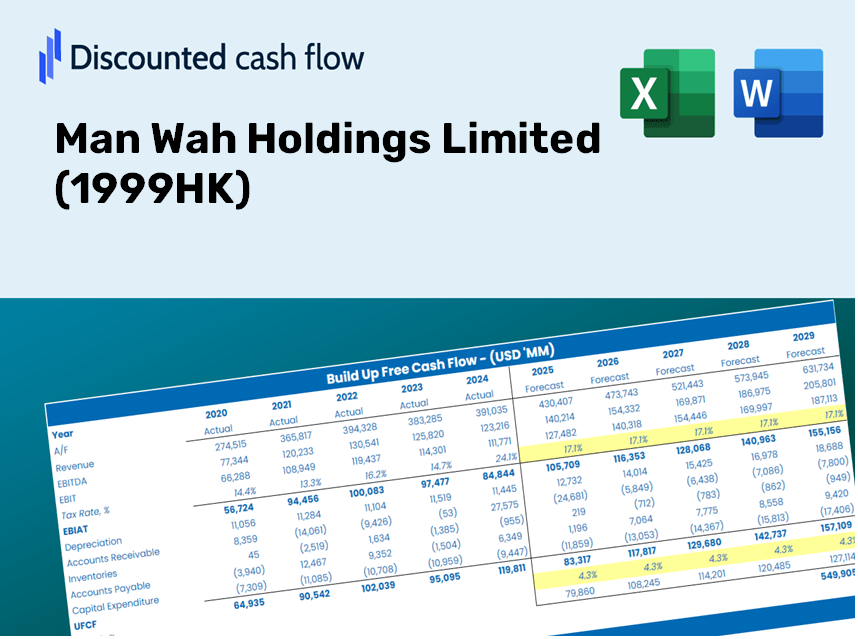
Leve suas decisões de investimento para o próximo nível com a calculadora DCF (1999HK)! Explore os autênticos Man Wah Holdings Limited Dados financeiros, ajustam as projeções e despesas de crescimento e visualize instantaneamente como essas mudanças afetam o valor intrínseco de (1999hk).
Discounted Cash Flow (DCF) - (USD MM)
| Year | AY1 2021 |
AY2 2022 |
AY3 2023 |
AY4 2024 |
AY5 2025 |
FY1 2026 |
FY2 2027 |
FY3 2028 |
FY4 2029 |
FY5 2030 |
|---|---|---|---|---|---|---|---|---|---|---|
| Revenue | 16,434.1 | 21,496.8 | 17,351.1 | 18,411.2 | 16,902.6 | 17,301.4 | 17,709.6 | 18,127.4 | 18,555.1 | 18,992.8 |
| Revenue Growth, % | 0 | 30.81 | -19.29 | 6.11 | -8.19 | 2.36 | 2.36 | 2.36 | 2.36 | 2.36 |
| EBITDA | 2,678.9 | 3,568.4 | 2,996.4 | 3,637.4 | 3,359.1 | 3,107.3 | 3,180.6 | 3,255.7 | 3,332.5 | 3,411.1 |
| EBITDA, % | 16.3 | 16.6 | 17.27 | 19.76 | 19.87 | 17.96 | 17.96 | 17.96 | 17.96 | 17.96 |
| Depreciation | 493.8 | 684.5 | 684.5 | 572.9 | 535.7 | 568.0 | 581.4 | 595.1 | 609.2 | 623.5 |
| Depreciation, % | 3 | 3.18 | 3.95 | 3.11 | 3.17 | 3.28 | 3.28 | 3.28 | 3.28 | 3.28 |
| EBIT | 2,185.1 | 2,883.9 | 2,311.9 | 3,064.5 | 2,823.4 | 2,539.3 | 2,599.2 | 2,660.5 | 2,723.3 | 2,787.6 |
| EBIT, % | 13.3 | 13.42 | 13.32 | 16.64 | 16.7 | 14.68 | 14.68 | 14.68 | 14.68 | 14.68 |
| Total Cash | 3,681.1 | 3,222.5 | 4,089.2 | 3,520.3 | 4,079.9 | 3,606.1 | 3,691.2 | 3,778.3 | 3,867.4 | 3,958.7 |
| Total Cash, percent | .0 | .0 | .0 | .0 | .0 | .0 | .0 | .0 | .0 | .0 |
| Account Receivables | 1,825.6 | 2,392.3 | 2,542.2 | 2,122.7 | 2,026.5 | 2,090.2 | 2,139.6 | 2,190.0 | 2,241.7 | 2,294.6 |
| Account Receivables, % | 11.11 | 11.13 | 14.65 | 11.53 | 11.99 | 12.08 | 12.08 | 12.08 | 12.08 | 12.08 |
| Inventories | 2,712.8 | 3,447.7 | 2,059.6 | 1,553.5 | 1,730.9 | 2,183.2 | 2,234.7 | 2,287.4 | 2,341.4 | 2,396.7 |
| Inventories, % | 16.51 | 16.04 | 11.87 | 8.44 | 10.24 | 12.62 | 12.62 | 12.62 | 12.62 | 12.62 |
| Accounts Payable | 971.1 | 1,155.9 | 950.9 | 710.2 | 653.2 | 847.4 | 867.4 | 887.9 | 908.8 | 930.2 |
| Accounts Payable, % | 5.91 | 5.38 | 5.48 | 3.86 | 3.86 | 4.9 | 4.9 | 4.9 | 4.9 | 4.9 |
| Capital Expenditure | -1,266.5 | -1,960.4 | -1,560.8 | -1,569.3 | -1,041.1 | -1,401.6 | -1,434.6 | -1,468.5 | -1,503.1 | -1,538.6 |
| Capital Expenditure, % | -7.71 | -9.12 | -9 | -8.52 | -6.16 | -8.1 | -8.1 | -8.1 | -8.1 | -8.1 |
| Tax Rate, % | 22.94 | 22.94 | 22.94 | 22.94 | 22.94 | 22.94 | 22.94 | 22.94 | 22.94 | 22.94 |
| EBITAT | 1,786.0 | 2,311.4 | 1,888.0 | 2,463.2 | 2,175.8 | 2,036.4 | 2,084.5 | 2,133.7 | 2,184.0 | 2,235.5 |
| Depreciation | ||||||||||
| Changes in Account Receivables | ||||||||||
| Changes in Inventories | ||||||||||
| Changes in Accounts Payable | ||||||||||
| Capital Expenditure | ||||||||||
| UFCF | -2,554.0 | -81.2 | 2,044.9 | 2,151.7 | 1,532.2 | 881.0 | 1,150.4 | 1,177.6 | 1,205.4 | 1,233.8 |
| WACC, % | 9.63 | 9.62 | 9.63 | 9.62 | 9.6 | 9.62 | 9.62 | 9.62 | 9.62 | 9.62 |
| PV UFCF | ||||||||||
| SUM PV UFCF | 4,269.1 | |||||||||
| Long Term Growth Rate, % | 0.50 | |||||||||
| Free cash flow (T + 1) | 1,240 | |||||||||
| Terminal Value | 13,595 | |||||||||
| Present Terminal Value | 8,589 | |||||||||
| Enterprise Value | 12,858 | |||||||||
| Net Debt | 1,023 | |||||||||
| Equity Value | 11,834 | |||||||||
| Diluted Shares Outstanding, MM | 3,878 | |||||||||
| Equity Value Per Share | 3.05 |
Benefits You Will Receive
- Accurate 1999HK Financial Data: Pre-loaded with Man Wah Holdings Limited’s historical and forecasted figures for precise analysis.
- Completely Customizable Template: Easily adjust key parameters such as revenue growth, WACC, and EBITDA percentage.
- Instant Calculations: Watch Man Wah's intrinsic value update in real-time as you make adjustments.
- Expert Valuation Tool: Tailored for investors, analysts, and consultants aiming for precise DCF outcomes.
- Intuitive Design: Clear layout and straightforward instructions suitable for users of all experience levels.
Key Features
- Pre-Loaded Data: Man Wah Holdings Limited's historical financial statements and pre-filled forecasts.
- Fully Adjustable Inputs: Customize WACC, tax rates, revenue growth, and EBITDA margins.
- Instant Results: View Man Wah Holdings Limited's intrinsic value recalculating in real time.
- Clear Visual Outputs: Dashboard charts illustrate valuation results and key metrics.
- Built for Accuracy: A professional tool designed for analysts, investors, and finance experts.
How It Operates
- Download: Get the ready-to-use Excel file containing Man Wah Holdings Limited's (1999HK) financial data.
- Customize: Modify forecasts, including revenue growth, EBITDA %, and WACC.
- Update Automatically: The intrinsic value and NPV calculations refresh in real-time.
- Test Scenarios: Develop various projections and compare results instantly.
- Make Decisions: Utilize the valuation outcomes to inform your investment strategy.
Why Choose This Calculator for Man Wah Holdings Limited (1999HK)?
- User-Friendly Design: Suitable for both novices and seasoned professionals.
- Customizable Inputs: Easily adjust variables to suit your financial analysis.
- Real-Time Feedback: Instantly observe how changes impact Man Wah's valuation.
- Pre-Loaded Data: Comes equipped with Man Wah's current financial information for rapid evaluation.
- Widely Recognized: Endorsed by investors and analysts for sound financial decision-making.
Who Can Benefit from This Product?
- Professional Investors: Create comprehensive and accurate valuation models for effective portfolio evaluation.
- Corporate Finance Teams: Assess valuation scenarios to inform and shape internal strategies.
- Consultants and Advisors: Deliver precise valuation insights for Man Wah Holdings Limited (1999HK) to clients.
- Students and Educators: Leverage real-world data for practical exercises in financial modeling and teaching.
- Industry Enthusiasts: Gain insights into how companies like Man Wah Holdings Limited (1999HK) are valued in the marketplace.
Contents of the Template
- Operating and Balance Sheet Data: Pre-filled historical data and forecasts for Man Wah Holdings Limited (1999HK), covering revenue, EBITDA, EBIT, and capital expenditures.
- WACC Calculation: A dedicated sheet for Weighted Average Cost of Capital (WACC), incorporating variables such as Beta, risk-free rate, and share price.
- DCF Valuation (Unlevered and Levered): Editable Discounted Cash Flow models providing insights into intrinsic value along with comprehensive calculations.
- Financial Statements: Pre-loaded annual and quarterly financial statements to facilitate thorough analysis.
- Key Ratios: A collection of profitability, leverage, and efficiency ratios specific to Man Wah Holdings Limited (1999HK).
- Dashboard and Charts: Visual representations of valuation outcomes and underlying assumptions for easier result analysis.
Disclaimer
All information, articles, and product details provided on this website are for general informational and educational purposes only. We do not claim any ownership over, nor do we intend to infringe upon, any trademarks, copyrights, logos, brand names, or other intellectual property mentioned or depicted on this site. Such intellectual property remains the property of its respective owners, and any references here are made solely for identification or informational purposes, without implying any affiliation, endorsement, or partnership.
We make no representations or warranties, express or implied, regarding the accuracy, completeness, or suitability of any content or products presented. Nothing on this website should be construed as legal, tax, investment, financial, medical, or other professional advice. In addition, no part of this site—including articles or product references—constitutes a solicitation, recommendation, endorsement, advertisement, or offer to buy or sell any securities, franchises, or other financial instruments, particularly in jurisdictions where such activity would be unlawful.
All content is of a general nature and may not address the specific circumstances of any individual or entity. It is not a substitute for professional advice or services. Any actions you take based on the information provided here are strictly at your own risk. You accept full responsibility for any decisions or outcomes arising from your use of this website and agree to release us from any liability in connection with your use of, or reliance upon, the content or products found herein.