
|
NIPPN CORPORATION (2001.T) Avaliação DCF |
Totalmente Editável: Adapte-Se Às Suas Necessidades No Excel Ou Planilhas
Design Profissional: Modelos Confiáveis E Padrão Da Indústria
Pré-Construídos Para Uso Rápido E Eficiente
Compatível com MAC/PC, totalmente desbloqueado
Não É Necessária Experiência; Fácil De Seguir
Nippn Corporation (2001.T) Bundle
Aprimore suas estratégias de investimento com a calculadora DCF da Nippn Corporation (2001t)! Explore as finanças autênticas do NIPPN, ajustam as projeções e despesas de crescimento e observe instantaneamente como essas mudanças afetam o valor intrínseco da NIPPN Corporation (2001t).
Benefits You'll Receive
- Pre-Filled Financial Model: Utilizes Nippn Corporation's (2001T) actual data to deliver an accurate DCF valuation.
- Comprehensive Forecast Control: Modify revenue growth, profit margins, WACC, and other essential variables.
- Real-Time Calculations: Instant updates provide immediate visibility into results as you make adjustments.
- Professional-Grade Template: An expertly crafted Excel file tailored for precise valuation.
- Flexible and Reusable: Designed for adaptability, enabling repeated application for thorough forecasts.
Key Features
- Customizable Forecast Inputs: Adjust essential metrics such as revenue growth, EBITDA margins, and capital investments.
- Instant DCF Valuation: Delivers intrinsic value, NPV, and other key outputs in real-time.
- Precision You Can Trust: Leverages Nippn Corporation's (2001T) actual financial data for accurate valuation results.
- Simplified Scenario Analysis: Experiment with various assumptions and effortlessly compare results.
- Efficiency Boost: Avoid the hassle of developing intricate valuation models from the ground up.
How It Works
- Step 1: Download the Excel file.
- Step 2: Review Nippn Corporation’s (2001T) pre-filled financial data and forecasts.
- Step 3: Adjust key inputs such as revenue growth, WACC, and tax rates (highlighted cells).
- Step 4: Observe the DCF model refresh in real-time as you modify assumptions.
- Step 5: Evaluate the outputs and leverage the results for your investment strategies.
Why Choose Nippn Corporation's Calculator?
- Time Efficient: Forget about building a DCF model from the ground up – it's ready for immediate use.
- Enhanced Accuracy: Dependable financial data and accurate formulas minimize valuation errors.
- Completely Customizable: Modify the model to align with your specific assumptions and forecasts.
- User-Friendly: Intuitive charts and outputs simplify the analysis of results.
- Expert-Recommended: Crafted for professionals who prioritize both precision and functionality.
Who Can Benefit from Nippn Corporation's (2001T) Product?
- Investors: Gain assurance in your investment choices with our expert-grade valuation tool.
- Financial Analysts: Enhance efficiency by utilizing our customizable pre-built DCF model.
- Consultants: Seamlessly modify the template for presentations or reports tailored to your clients.
- Finance Enthusiasts: Expand your knowledge of valuation methodologies through practical case studies.
- Educators and Students: Leverage this resource as a hands-on learning tool in finance courses.
Contents of the Template
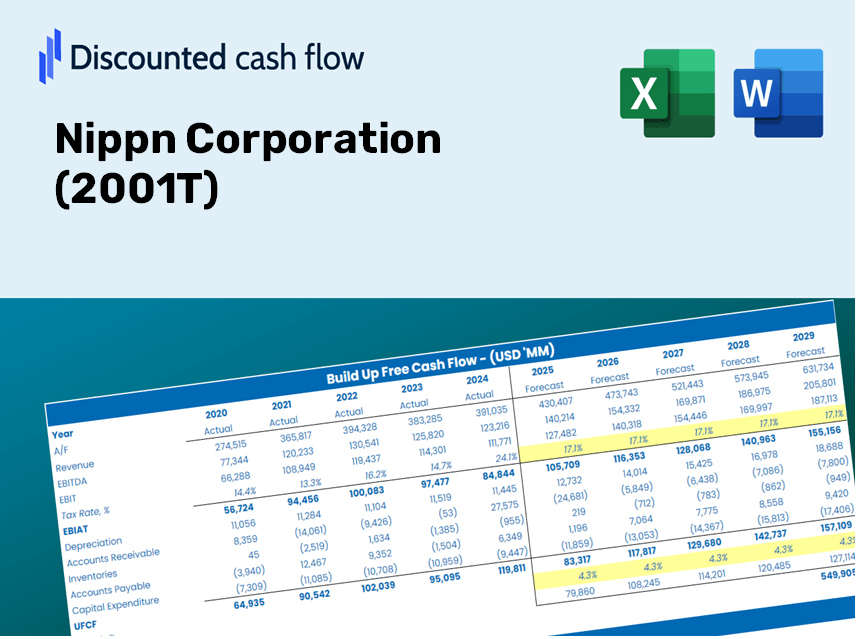
- Operating and Balance Sheet Data: Pre-filled historical data and forecasts for Nippn Corporation (2001T), including metrics such as revenue, EBITDA, EBIT, and capital expenditures.
- WACC Calculation: A specific sheet dedicated to the Weighted Average Cost of Capital (WACC), featuring parameters like Beta, risk-free rate, and share price.
- DCF Valuation (Unlevered and Levered): Customizable Discounted Cash Flow models that reveal intrinsic value along with comprehensive calculations.
- Financial Statements: Pre-loaded annual and quarterly financial statements to facilitate thorough analysis.
- Key Ratios: Includes essential ratios related to profitability, leverage, and efficiency for Nippn Corporation (2001T).
- Dashboard and Charts: Visual overview of valuation outputs and underlying assumptions, designed for easy result analysis.
Disclaimer
All information, articles, and product details provided on this website are for general informational and educational purposes only. We do not claim any ownership over, nor do we intend to infringe upon, any trademarks, copyrights, logos, brand names, or other intellectual property mentioned or depicted on this site. Such intellectual property remains the property of its respective owners, and any references here are made solely for identification or informational purposes, without implying any affiliation, endorsement, or partnership.
We make no representations or warranties, express or implied, regarding the accuracy, completeness, or suitability of any content or products presented. Nothing on this website should be construed as legal, tax, investment, financial, medical, or other professional advice. In addition, no part of this site—including articles or product references—constitutes a solicitation, recommendation, endorsement, advertisement, or offer to buy or sell any securities, franchises, or other financial instruments, particularly in jurisdictions where such activity would be unlawful.
All content is of a general nature and may not address the specific circumstances of any individual or entity. It is not a substitute for professional advice or services. Any actions you take based on the information provided here are strictly at your own risk. You accept full responsibility for any decisions or outcomes arising from your use of this website and agree to release us from any liability in connection with your use of, or reliance upon, the content or products found herein.