
|
China Zheshang Bank Co., Ltd (2016.HK) Avaliação DCF |
Totalmente Editável: Adapte-Se Às Suas Necessidades No Excel Ou Planilhas
Design Profissional: Modelos Confiáveis E Padrão Da Indústria
Pré-Construídos Para Uso Rápido E Eficiente
Compatível com MAC/PC, totalmente desbloqueado
Não É Necessária Experiência; Fácil De Seguir
China Zheshang Bank Co., Ltd (2016.HK) Bundle
Procurando avaliar o valor intrínseco da China Zheshang Bank Co., Ltd? Nossa calculadora DCF (2016HK) integra dados do mundo real com recursos abrangentes de personalização, permitindo ajustar as previsões e aprimorar suas estratégias de investimento.
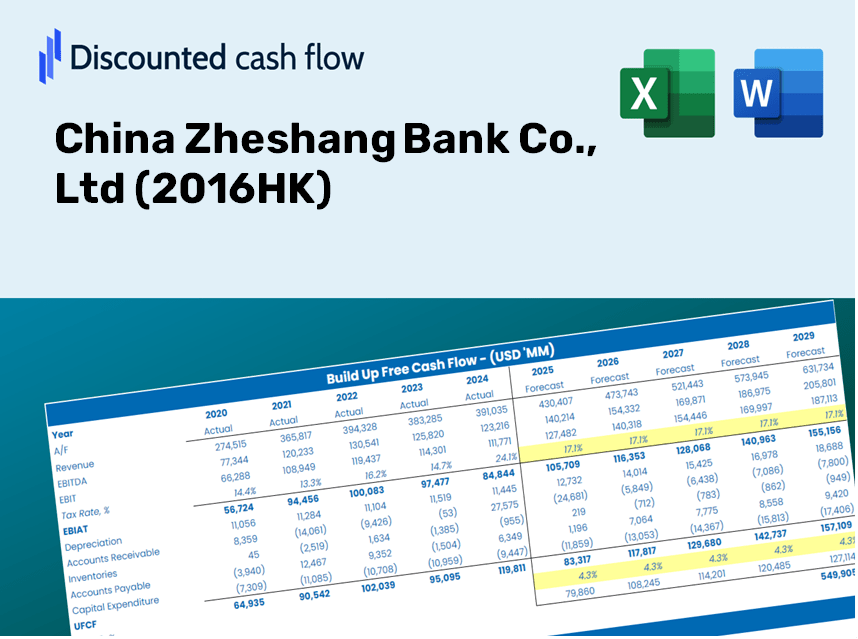
Discounted Cash Flow (DCF) - (USD MM)
| Year | AY1 2020 |
AY2 2021 |
AY3 2022 |
AY4 2023 |
AY5 2024 |
FY1 2025 |
FY2 2026 |
FY3 2027 |
FY4 2028 |
FY5 2029 |
|---|---|---|---|---|---|---|---|---|---|---|
| Revenue | 30,252.1 | 32,482.2 | 36,466.8 | 40,718.9 | 72,107.4 | 91,645.8 | 116,478.3 | 148,039.6 | 188,152.7 | 239,135.0 |
| Revenue Growth, % | 0 | 7.37 | 12.27 | 11.66 | 77.09 | 27.1 | 27.1 | 27.1 | 27.1 | 27.1 |
| EBITDA | .0 | 18,257.5 | 19,389.6 | .0 | .0 | 20,048.1 | 25,480.4 | 32,384.6 | 41,159.6 | 52,312.3 |
| EBITDA, % | 0 | 56.21 | 53.17 | 0 | 0 | 21.88 | 21.88 | 21.88 | 21.88 | 21.88 |
| Depreciation | 1,709.6 | 1,840.0 | 2,040.5 | 2,314.5 | 2,709.0 | 4,830.2 | 6,139.0 | 7,802.4 | 9,916.6 | 12,603.6 |
| Depreciation, % | 5.65 | 5.66 | 5.6 | 5.68 | 3.76 | 5.27 | 5.27 | 5.27 | 5.27 | 5.27 |
| EBIT | -1,709.6 | 16,417.5 | 17,349.0 | -2,314.5 | -2,709.0 | 15,217.9 | 19,341.4 | 24,582.2 | 31,243.0 | 39,708.7 |
| EBIT, % | -5.65 | 50.54 | 47.57 | -5.68 | -3.76 | 16.61 | 16.61 | 16.61 | 16.61 | 16.61 |
| Total Cash | 221,001.6 | 219,184.7 | 277,804.9 | 105,214.2 | 239,319.5 | 91,645.8 | 116,478.3 | 148,039.6 | 188,152.7 | 239,135.0 |
| Total Cash, percent | .0 | .0 | .0 | .0 | .0 | .0 | .0 | .0 | .0 | .0 |
| Account Receivables | 4,521.6 | 5,822.5 | 7,466.3 | 134,083.3 | 152,835.1 | 46,436.2 | 59,018.6 | 75,010.4 | 95,335.4 | 121,167.7 |
| Account Receivables, % | 14.95 | 17.93 | 20.47 | 329.29 | 211.95 | 50.67 | 50.67 | 50.67 | 50.67 | 50.67 |
| Inventories | .0 | .0 | .0 | .0 | .0 | .0 | .0 | .0 | .0 | .0 |
| Inventories, % | 0 | 0 | 0 | 0 | 0 | 0 | 0 | 0 | 0 | 0 |
| Accounts Payable | 3,842.2 | 5,170.4 | 31,124.4 | 39,648.2 | 47,024.7 | 50,689.9 | 64,425.0 | 81,881.7 | 104,068.5 | 132,267.2 |
| Accounts Payable, % | 12.7 | 15.92 | 85.35 | 97.37 | 65.21 | 55.31 | 55.31 | 55.31 | 55.31 | 55.31 |
| Capital Expenditure | -1,904.7 | -2,797.8 | -5,907.9 | -10,827.4 | -11,729.3 | -13,557.6 | -17,231.2 | -21,900.2 | -27,834.3 | -35,376.3 |
| Capital Expenditure, % | -6.3 | -8.61 | -16.2 | -26.59 | -16.27 | -14.79 | -14.79 | -14.79 | -14.79 | -14.79 |
| Tax Rate, % | 13.61 | 13.61 | 13.61 | 13.61 | 13.61 | 13.61 | 13.61 | 13.61 | 13.61 | 13.61 |
| EBITAT | -1,465.1 | 13,860.8 | 14,923.8 | -1,991.1 | -2,340.3 | 13,043.7 | 16,578.0 | 21,070.0 | 26,779.2 | 34,035.3 |
| Depreciation | ||||||||||
| Changes in Account Receivables | ||||||||||
| Changes in Inventories | ||||||||||
| Changes in Accounts Payable | ||||||||||
| Capital Expenditure | ||||||||||
| UFCF | -2,339.6 | 12,930.4 | 35,366.6 | -128,597.2 | -22,735.9 | 114,380.4 | 6,638.4 | 8,437.2 | 10,723.4 | 13,629.0 |
| WACC, % | 9.13 | 9 | 9.16 | 9.16 | 9.2 | 9.13 | 9.13 | 9.13 | 9.13 | 9.13 |
| PV UFCF | ||||||||||
| SUM PV UFCF | 133,238.6 | |||||||||
| Long Term Growth Rate, % | 2.00 | |||||||||
| Free cash flow (T + 1) | 13,902 | |||||||||
| Terminal Value | 194,911 | |||||||||
| Present Terminal Value | 125,913 | |||||||||
| Enterprise Value | 259,152 | |||||||||
| Net Debt | -239,319 | |||||||||
| Equity Value | 498,471 | |||||||||
| Diluted Shares Outstanding, MM | 27,464 | |||||||||
| Equity Value Per Share | 18.15 |
What You Will Receive
- Editable Input Parameters: Effortlessly adjust key assumptions (growth %, margins, WACC) to explore various scenarios.
- Comprehensive Financial Data: China Zheshang Bank Co., Ltd’s (2016HK) financials pre-loaded to facilitate your analysis.
- Automated DCF Calculations: The model computes Net Present Value (NPV) and intrinsic value automatically.
- Customizable and Professional Design: A refined Excel model tailored to fit your valuation requirements.
- Built for Analysts and Investors: Perfect for evaluating projections, confirming strategies, and optimizing your time.
Key Features
- Comprehensive 2016HK Data: Pre-filled with China Zheshang Bank's historical financial performance and future growth forecasts.
- Fully Customizable Inputs: Tailor revenue growth, profit margins, cost of capital, tax considerations, and capital investments as per your analysis.
- Dynamic Valuation Model: Automatic recalculations of Net Present Value (NPV) and intrinsic value based on your adjusted parameters.
- Scenario Analysis: Develop multiple forecasting scenarios to assess various valuation results.
- User-Friendly Interface: Intuitive, well-organized design catering to both experts and novices.
How It Works
- Step 1: Download the Excel file.
- Step 2: Review China Zheshang Bank's pre-filled financial data and forecasts.
- Step 3: Adjust key inputs such as revenue growth, WACC, and tax rates (highlighted cells).
- Step 4: Observe the DCF model update in real-time as you modify your assumptions.
- Step 5: Assess the outputs and leverage the results for your investment strategies.
Why Opt for This Calculator?
- Time Efficient: Skip the hassle of building a DCF model from scratch – it's ready for immediate use.
- Enhanced Accuracy: Dependable financial data and formulas minimize valuation errors.
- Completely Customizable: Adjust the model to align with your assumptions and forecasts.
- User-Friendly: Intuitive charts and outputs simplify result analysis.
- Endorsed by Professionals: Crafted for those who prioritize precision and functionality.
Who Should Utilize This Product?
- Investors: Evaluate the valuation of China Zheshang Bank (2016HK) before making stock trades.
- CFOs and Financial Analysts: Optimize valuation workflows and validate financial forecasts.
- Startup Founders: Discover how established financial institutions like China Zheshang Bank are appraised.
- Consultants: Produce comprehensive valuation reports for client engagements.
- Students and Educators: Utilize current industry data to practice and instruct on valuation methods.
Template Overview
- Operating and Balance Sheet Data: Pre-filled historical data and forecasts for China Zheshang Bank Co., Ltd (2016HK), including revenue, EBITDA, EBIT, and capital expenditures.
- WACC Calculation: A dedicated sheet for Weighted Average Cost of Capital (WACC), featuring parameters such as Beta, risk-free rate, and share price.
- DCF Valuation (Unlevered and Levered): Customizable Discounted Cash Flow models illustrating intrinsic value with comprehensive calculations.
- Financial Statements: Pre-loaded annual and quarterly financial statements to facilitate thorough analysis.
- Key Ratios: Contains profitability, leverage, and efficiency ratios for China Zheshang Bank Co., Ltd (2016HK).
- Dashboard and Charts: Visual representation of valuation outputs and underlying assumptions to simplify result analysis.
Disclaimer
All information, articles, and product details provided on this website are for general informational and educational purposes only. We do not claim any ownership over, nor do we intend to infringe upon, any trademarks, copyrights, logos, brand names, or other intellectual property mentioned or depicted on this site. Such intellectual property remains the property of its respective owners, and any references here are made solely for identification or informational purposes, without implying any affiliation, endorsement, or partnership.
We make no representations or warranties, express or implied, regarding the accuracy, completeness, or suitability of any content or products presented. Nothing on this website should be construed as legal, tax, investment, financial, medical, or other professional advice. In addition, no part of this site—including articles or product references—constitutes a solicitation, recommendation, endorsement, advertisement, or offer to buy or sell any securities, franchises, or other financial instruments, particularly in jurisdictions where such activity would be unlawful.
All content is of a general nature and may not address the specific circumstances of any individual or entity. It is not a substitute for professional advice or services. Any actions you take based on the information provided here are strictly at your own risk. You accept full responsibility for any decisions or outcomes arising from your use of this website and agree to release us from any liability in connection with your use of, or reliance upon, the content or products found herein.