
|
Mixi, Inc. (2121.T) Avaliação DCF |
Totalmente Editável: Adapte-Se Às Suas Necessidades No Excel Ou Planilhas
Design Profissional: Modelos Confiáveis E Padrão Da Indústria
Pré-Construídos Para Uso Rápido E Eficiente
Compatível com MAC/PC, totalmente desbloqueado
Não É Necessária Experiência; Fácil De Seguir
mixi, Inc. (2121.T) Bundle
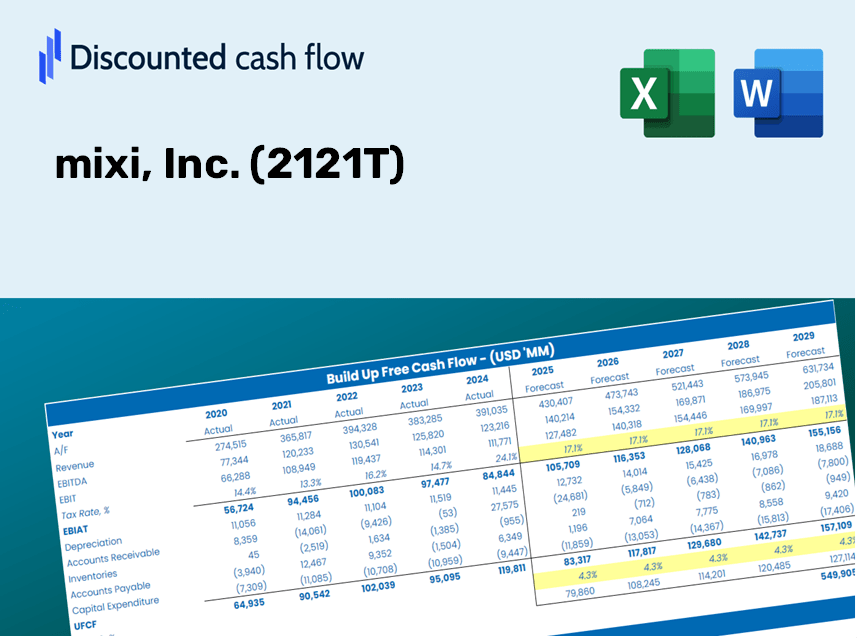
Como investidor ou analista, a calculadora DCF Mixi, Inc. (2121T) é o seu recurso preferido para uma avaliação precisa. Apresentando dados reais da Mixi, Inc., você pode ajustar as previsões e observar instantaneamente os efeitos.
What You Will Receive
- Customizable Excel Template: A fully adjustable Excel-based DCF Calculator featuring pre-filled financial data for mixi, Inc. (2121T).
- Real-World Insights: Access to historical data and forward-looking projections (displayed in the highlighted cells).
- Forecasting Flexibility: Modify key assumptions such as revenue growth, EBITDA %, and WACC.
- Instant Calculations: Quickly observe how your inputs affect the valuation of mixi, Inc. (2121T).
- Professional Resource: Designed for investors, CFOs, consultants, and financial analysts.
- User-Friendly Interface: Organized for straightforward navigation, complete with step-by-step guidance.
Key Features
- Accurate Financial Data: Gain access to reliable historical data and future forecasts for Mixi, Inc. (2121T).
- Tailored Forecast Inputs: Modify highlighted cells for key assumptions like WACC, growth rates, and profit margins.
- Automated Calculations: Enjoy real-time updates on DCF, Net Present Value (NPV), and cash flow assessments.
- Interactive Dashboard: Utilize clear charts and summaries to effectively present your valuation outcomes.
- Designed for All Levels: An intuitive layout suitable for investors, CFOs, and consultants alike.
How It Works
- Step 1: Download the Excel file.
- Step 2: Review mixi, Inc.'s pre-filled financial data and forecasts.
- Step 3: Adjust key inputs such as revenue growth, WACC, and tax rates (highlighted cells).
- Step 4: Observe the DCF model refresh instantly as you modify assumptions.
- Step 5: Evaluate the outputs and leverage the results for your investment decisions.
Why Select mixi, Inc. (2121T) Calculator?
- Precision: Utilizes real mixi, Inc. (2121T) financial data for reliable outcomes.
- Versatility: Tailored for users to easily explore and adjust input parameters.
- Efficiency: Eliminate the complexity of creating a DCF model from the ground up.
- High-Quality: Crafted with precision akin to CFO-level financial tools.
- Accessible: Intuitive interface suitable for users at any financial modeling skill level.
Who Should Use This Product?
- Individual Investors: Make informed choices on buying or selling mixi, Inc. (2121T) stock.
- Financial Analysts: Enhance valuation workflows with comprehensive financial models tailored for mixi, Inc. (2121T).
- Consultants: Provide clients with quick and accurate valuation insights on mixi, Inc. (2121T).
- Business Owners: Gain insights into the valuation of companies like mixi, Inc. (2121T) to inform your own business strategies.
- Finance Students: Explore valuation methodologies using real-world data and examples related to mixi, Inc. (2121T).
Contents of the Template
- Pre-Filled Data: Contains historical financial information and projections for mixi, Inc. (2121T).
- Discounted Cash Flow Model: An editable DCF valuation model featuring automatic calculations.
- Weighted Average Cost of Capital (WACC): A dedicated worksheet for computing WACC using customized inputs.
- Key Financial Ratios: Assess mixi, Inc. (2121T)'s profitability, operational efficiency, and financial leverage.
- Customizable Inputs: Easily modify assumptions for revenue growth, profit margins, and tax rates.
- User-Friendly Dashboard: Visual representations and tables summarizing essential valuation outcomes.
Disclaimer
All information, articles, and product details provided on this website are for general informational and educational purposes only. We do not claim any ownership over, nor do we intend to infringe upon, any trademarks, copyrights, logos, brand names, or other intellectual property mentioned or depicted on this site. Such intellectual property remains the property of its respective owners, and any references here are made solely for identification or informational purposes, without implying any affiliation, endorsement, or partnership.
We make no representations or warranties, express or implied, regarding the accuracy, completeness, or suitability of any content or products presented. Nothing on this website should be construed as legal, tax, investment, financial, medical, or other professional advice. In addition, no part of this site—including articles or product references—constitutes a solicitation, recommendation, endorsement, advertisement, or offer to buy or sell any securities, franchises, or other financial instruments, particularly in jurisdictions where such activity would be unlawful.
All content is of a general nature and may not address the specific circumstances of any individual or entity. It is not a substitute for professional advice or services. Any actions you take based on the information provided here are strictly at your own risk. You accept full responsibility for any decisions or outcomes arising from your use of this website and agree to release us from any liability in connection with your use of, or reliance upon, the content or products found herein.