
|
Nihon M&A Center Holdings Inc. (2127.T) Avaliação DCF |
Totalmente Editável: Adapte-Se Às Suas Necessidades No Excel Ou Planilhas
Design Profissional: Modelos Confiáveis E Padrão Da Indústria
Pré-Construídos Para Uso Rápido E Eficiente
Compatível com MAC/PC, totalmente desbloqueado
Não É Necessária Experiência; Fácil De Seguir
Nihon M&A Center Holdings Inc. (2127.T) Bundle
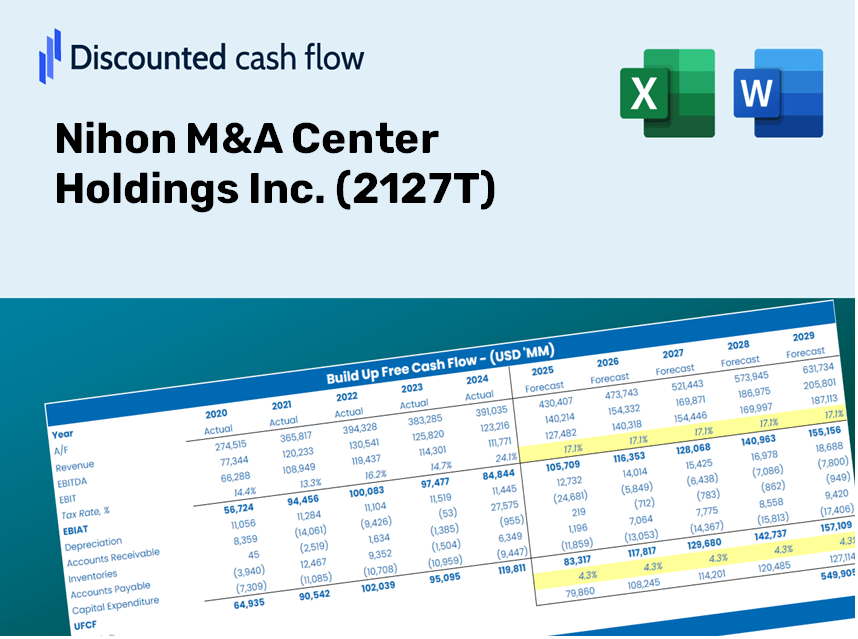
Otimize seu fluxo de trabalho e melhore a precisão com a nossa calculadora DCF (2127T)! Utilizando dados reais da Nihon M&A Center Holdings Inc. e suposições personalizáveis, essa ferramenta permite prever, analisar e valorizar (2127T), assim como um investidor experiente.
Discounted Cash Flow (DCF) - (USD MM)
| Year | AY1 2021 |
AY2 2022 |
AY3 2023 |
AY4 2024 |
AY5 2025 |
FY1 2026 |
FY2 2027 |
FY3 2028 |
FY4 2029 |
FY5 2030 |
|---|---|---|---|---|---|---|---|---|---|---|
| Revenue | 34,795.2 | 40,401.6 | 41,315.7 | 44,136.9 | 44,077.7 | 46,840.2 | 49,775.9 | 52,895.5 | 56,210.6 | 59,733.5 |
| Revenue Growth, % | 0 | 16.11 | 2.26 | 6.83 | -0.13409 | 6.27 | 6.27 | 6.27 | 6.27 | 6.27 |
| EBITDA | 15,760.3 | 16,826.5 | 15,700.1 | 16,709.1 | 17,116.3 | 18,889.0 | 20,072.9 | 21,330.9 | 22,667.8 | 24,088.5 |
| EBITDA, % | 45.29 | 41.65 | 38 | 37.86 | 38.83 | 40.33 | 40.33 | 40.33 | 40.33 | 40.33 |
| Depreciation | 140.3 | 164.6 | 227.2 | 174.7 | 159.0 | 198.3 | 210.8 | 224.0 | 238.0 | 252.9 |
| Depreciation, % | 0.40324 | 0.40746 | 0.54986 | 0.39583 | 0.36065 | 0.42341 | 0.42341 | 0.42341 | 0.42341 | 0.42341 |
| EBIT | 15,620.0 | 16,661.9 | 15,472.9 | 16,534.4 | 16,957.3 | 18,690.7 | 19,862.1 | 21,106.9 | 22,429.8 | 23,835.5 |
| EBIT, % | 44.89 | 41.24 | 37.45 | 37.46 | 38.47 | 39.9 | 39.9 | 39.9 | 39.9 | 39.9 |
| Total Cash | 42,863.8 | 47,303.4 | 45,575.0 | 37,439.8 | 39,211.2 | 44,384.4 | 47,166.2 | 50,122.2 | 53,263.6 | 56,601.8 |
| Total Cash, percent | .0 | .0 | .0 | .0 | .0 | .0 | .0 | .0 | .0 | .0 |
| Account Receivables | 3,049.6 | 1,460.0 | 2,990.0 | 2,579.2 | 2,633.0 | 2,944.6 | 3,129.1 | 3,325.2 | 3,533.6 | 3,755.1 |
| Account Receivables, % | 8.76 | 3.61 | 7.24 | 5.84 | 5.97 | 6.29 | 6.29 | 6.29 | 6.29 | 6.29 |
| Inventories | .0 | .0 | .0 | .0 | .0 | .0 | .0 | .0 | .0 | .0 |
| Inventories, % | 0 | 0 | 0 | 0 | 0 | 0 | 0 | 0 | 0 | 0 |
| Accounts Payable | 550.8 | 560.9 | 878.9 | 924.0 | 1,088.3 | 905.1 | 961.8 | 1,022.1 | 1,086.1 | 1,154.2 |
| Accounts Payable, % | 1.58 | 1.39 | 2.13 | 2.09 | 2.47 | 1.93 | 1.93 | 1.93 | 1.93 | 1.93 |
| Capital Expenditure | -139.8 | -254.8 | -318.6 | -130.7 | -71.2 | -211.8 | -225.1 | -239.2 | -254.2 | -270.1 |
| Capital Expenditure, % | -0.40167 | -0.63064 | -0.77107 | -0.29616 | -0.16147 | -0.4522 | -0.4522 | -0.4522 | -0.4522 | -0.4522 |
| Tax Rate, % | 35.28 | 35.28 | 35.28 | 35.28 | 35.28 | 35.28 | 35.28 | 35.28 | 35.28 | 35.28 |
| EBITAT | 10,681.6 | 11,438.0 | 9,842.9 | 10,737.3 | 10,974.1 | 12,347.1 | 13,120.9 | 13,943.3 | 14,817.1 | 15,745.8 |
| Depreciation | ||||||||||
| Changes in Account Receivables | ||||||||||
| Changes in Inventories | ||||||||||
| Changes in Accounts Payable | ||||||||||
| Capital Expenditure | ||||||||||
| UFCF | 8,183.4 | 12,947.4 | 8,539.6 | 11,237.2 | 11,172.2 | 11,838.9 | 12,978.8 | 13,792.2 | 14,656.6 | 15,575.2 |
| WACC, % | 10.84 | 10.84 | 10.84 | 10.84 | 10.84 | 10.84 | 10.84 | 10.84 | 10.84 | 10.84 |
| PV UFCF | ||||||||||
| SUM PV UFCF | 50,395.4 | |||||||||
| Long Term Growth Rate, % | 2.00 | |||||||||
| Free cash flow (T + 1) | 15,887 | |||||||||
| Terminal Value | 179,728 | |||||||||
| Present Terminal Value | 107,436 | |||||||||
| Enterprise Value | 157,831 | |||||||||
| Net Debt | -33,811 | |||||||||
| Equity Value | 191,642 | |||||||||
| Diluted Shares Outstanding, MM | 317 | |||||||||
| Equity Value Per Share | 604.16 |
Your Benefits
- Adjustable Forecast Parameters: Modify key inputs (growth %, margins, WACC) effortlessly to explore various scenarios.
- Actual Market Data: Pre-filled financial information for Nihon M&A Center Holdings Inc. (2127T) to kickstart your analysis.
- Automated DCF Calculations: The template computes Net Present Value (NPV) and intrinsic value automatically.
- Tailored and Professional Design: A refined Excel model that aligns with your valuation requirements.
- Designed for Analysts and Investors: Perfect for evaluating projections, confirming strategies, and enhancing efficiency.
Highlighted Features
- Authentic Financial Data: Access precise, pre-loaded historical data and forecasts for Nihon M&A Center Holdings Inc. (2127T).
- Tailored Forecast Parameters: Adjust editable cells highlighted in yellow, including WACC, growth rates, and profit margins.
- Automated Calculations: Real-time updates for DCF, Net Present Value (NPV), and cash flow assessments.
- Interactive Dashboard: User-friendly charts and summaries designed to present your valuation outcomes clearly.
- Suitable for All Skill Levels: An intuitive layout designed for investors, CFOs, and consultants, whether novice or expert.
How It Works
- Download: Obtain the pre-configured Excel file containing Nihon M&A Center Holdings Inc.'s (2127T) financial data.
- Customize: Tailor your forecasts, such as revenue growth, EBITDA %, and WACC to fit your analysis.
- Update Automatically: Intrinsic value and NPV calculations refresh in real-time as you make changes.
- Test Scenarios: Generate various projections and instantly compare the results.
- Make Decisions: Leverage the valuation insights to inform your investment strategy.
Why Opt for the Nihon M&A Center Holdings Inc. (2127T) Calculator?
- All-in-One Solution: Features DCF, WACC, and various financial ratio analyses seamlessly integrated.
- Flexible Inputs: Modify yellow-highlighted fields to explore different scenarios.
- In-Depth Analysis: Automatically determines the intrinsic value and Net Present Value for Nihon M&A Center Holdings Inc.
- Loaded Data: Comes with both historical and projected data to provide reliable starting information.
- Expert Standard: Perfect for financial analysts, investors, and business consultants seeking professional insights.
Who Should Utilize This Service?
- Investors: Evaluate Nihon M&A Center Holdings Inc.'s (2127T) market position before making investment decisions.
- CFOs and Financial Analysts: Optimize valuation procedures and refine financial projections.
- Startup Founders: Gain insights into the valuation practices of established companies like Nihon M&A Center Holdings Inc. (2127T).
- Consultants: Provide comprehensive valuation reports and analyses for client needs.
- Students and Educators: Utilize real-world examples to enhance learning and teaching of valuation methods.
Contents of the Template
- Pre-Filled Data: Contains historical financials and forecasts for Nihon M&A Center Holdings Inc. (2127T).
- Discounted Cash Flow Model: An editable DCF valuation model with automatic calculation features.
- Weighted Average Cost of Capital (WACC): A specialized sheet for computing WACC using customized inputs.
- Key Financial Ratios: Evaluate Nihon M&A's profitability, efficiency, and leverage metrics.
- Customizable Inputs: Easily modify revenue growth, profit margins, and tax rates.
- Clear Dashboard: Visual representations and tables that highlight essential valuation outcomes.
Disclaimer
All information, articles, and product details provided on this website are for general informational and educational purposes only. We do not claim any ownership over, nor do we intend to infringe upon, any trademarks, copyrights, logos, brand names, or other intellectual property mentioned or depicted on this site. Such intellectual property remains the property of its respective owners, and any references here are made solely for identification or informational purposes, without implying any affiliation, endorsement, or partnership.
We make no representations or warranties, express or implied, regarding the accuracy, completeness, or suitability of any content or products presented. Nothing on this website should be construed as legal, tax, investment, financial, medical, or other professional advice. In addition, no part of this site—including articles or product references—constitutes a solicitation, recommendation, endorsement, advertisement, or offer to buy or sell any securities, franchises, or other financial instruments, particularly in jurisdictions where such activity would be unlawful.
All content is of a general nature and may not address the specific circumstances of any individual or entity. It is not a substitute for professional advice or services. Any actions you take based on the information provided here are strictly at your own risk. You accept full responsibility for any decisions or outcomes arising from your use of this website and agree to release us from any liability in connection with your use of, or reliance upon, the content or products found herein.