
|
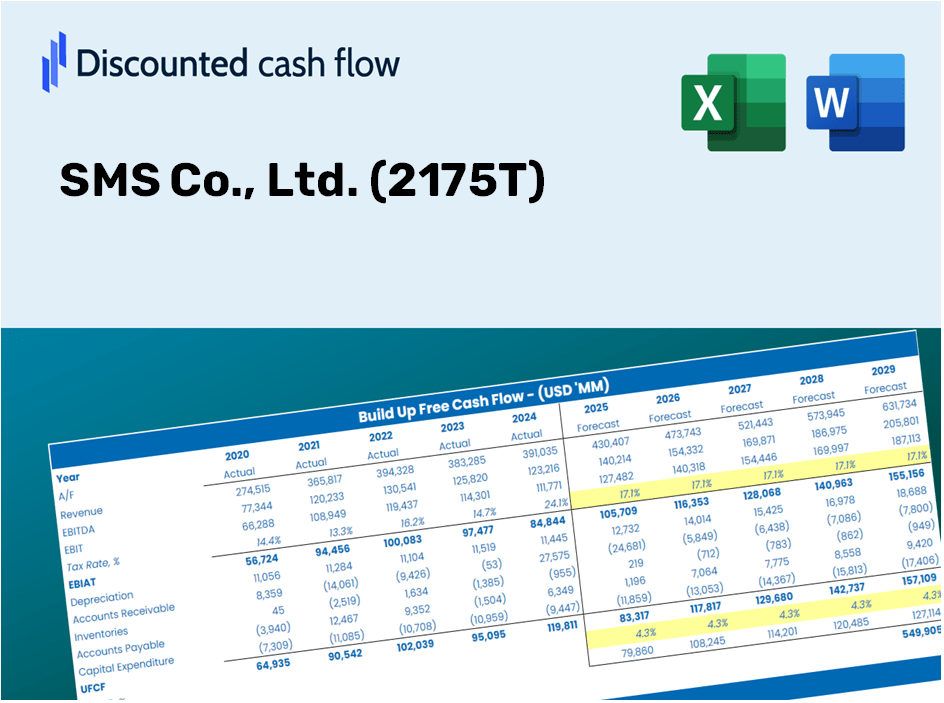
SMS Co., Ltd. (2175.T) Avaliação DCF |
Totalmente Editável: Adapte-Se Às Suas Necessidades No Excel Ou Planilhas
Design Profissional: Modelos Confiáveis E Padrão Da Indústria
Pré-Construídos Para Uso Rápido E Eficiente
Compatível com MAC/PC, totalmente desbloqueado
Não É Necessária Experiência; Fácil De Seguir
SMS Co., Ltd. (2175.T) Bundle
Descubra o verdadeiro potencial da SMS Co., Ltd. (2175T) com nossa calculadora DCF avançada! Ajuste as suposições -chave, explore vários cenários e avalie como as mudanças afetam a avaliação da SMS Co., Ltd. (2175T) - tudo dentro de um único modelo do Excel.
Discounted Cash Flow (DCF) - (USD MM)
| Year | AY1 2021 |
AY2 2022 |
AY3 2023 |
AY4 2024 |
AY5 2025 |
FY1 2026 |
FY2 2027 |
FY3 2028 |
FY4 2029 |
FY5 2030 |
|---|---|---|---|---|---|---|---|---|---|---|
| Revenue | 35,960.0 | 38,899.0 | 45,667.0 | 53,973.0 | 60,952.0 | 69,590.5 | 79,453.3 | 90,714.0 | 103,570.6 | 118,249.2 |
| Revenue Growth, % | 0 | 8.17 | 17.4 | 18.19 | 12.93 | 14.17 | 14.17 | 14.17 | 14.17 | 14.17 |
| EBITDA | 8,745.0 | 10,268.0 | 11,760.0 | 13,265.0 | 12,145.0 | 16,836.7 | 19,222.9 | 21,947.3 | 25,057.8 | 28,609.1 |
| EBITDA, % | 24.32 | 26.4 | 25.75 | 24.58 | 19.93 | 24.19 | 24.19 | 24.19 | 24.19 | 24.19 |
| Depreciation | 2,185.0 | 2,482.0 | 2,896.0 | 3,456.0 | 3,813.0 | 4,378.3 | 4,998.8 | 5,707.2 | 6,516.1 | 7,439.6 |
| Depreciation, % | 6.08 | 6.38 | 6.34 | 6.4 | 6.26 | 6.29 | 6.29 | 6.29 | 6.29 | 6.29 |
| EBIT | 6,560.0 | 7,786.0 | 8,864.0 | 9,809.0 | 8,332.0 | 12,458.4 | 14,224.1 | 16,240.0 | 18,541.7 | 21,169.5 |
| EBIT, % | 18.24 | 20.02 | 19.41 | 18.17 | 13.67 | 17.9 | 17.9 | 17.9 | 17.9 | 17.9 |
| Total Cash | 10,538.0 | 14,640.0 | 16,965.0 | 18,236.0 | 16,175.0 | 22,883.4 | 26,126.6 | 29,829.4 | 34,057.0 | 38,883.8 |
| Total Cash, percent | .0 | .0 | .0 | .0 | .0 | .0 | .0 | .0 | .0 | .0 |
| Account Receivables | 11,667.0 | 11,257.0 | 14,676.0 | 18,367.0 | 21,037.0 | 22,556.3 | 25,753.1 | 29,403.0 | 33,570.2 | 38,328.0 |
| Account Receivables, % | 32.44 | 28.94 | 32.14 | 34.03 | 34.51 | 32.41 | 32.41 | 32.41 | 32.41 | 32.41 |
| Inventories | 47.0 | 53.0 | 49.0 | 38.0 | 117.0 | 88.6 | 101.2 | 115.5 | 131.9 | 150.6 |
| Inventories, % | 0.1307 | 0.13625 | 0.1073 | 0.07040557 | 0.19195 | 0.12732 | 0.12732 | 0.12732 | 0.12732 | 0.12732 |
| Accounts Payable | 258.0 | 307.0 | 324.0 | 460.0 | 423.0 | 523.7 | 597.9 | 682.6 | 779.4 | 889.8 |
| Accounts Payable, % | 0.71746 | 0.78922 | 0.70948 | 0.85228 | 0.69399 | 0.75249 | 0.75249 | 0.75249 | 0.75249 | 0.75249 |
| Capital Expenditure | -2,035.0 | -2,012.0 | -2,914.0 | -3,712.0 | -425.0 | -3,449.9 | -3,938.9 | -4,497.1 | -5,134.4 | -5,862.1 |
| Capital Expenditure, % | -5.66 | -5.17 | -6.38 | -6.88 | -0.69727 | -4.96 | -4.96 | -4.96 | -4.96 | -4.96 |
| Tax Rate, % | 26.45 | 26.45 | 26.45 | 26.45 | 26.45 | 26.45 | 26.45 | 26.45 | 26.45 | 26.45 |
| EBITAT | 4,866.8 | 5,463.4 | 6,456.3 | 7,276.7 | 6,128.3 | 9,092.9 | 10,381.6 | 11,853.0 | 13,532.8 | 15,450.8 |
| Depreciation | ||||||||||
| Changes in Account Receivables | ||||||||||
| Changes in Inventories | ||||||||||
| Changes in Accounts Payable | ||||||||||
| Capital Expenditure | ||||||||||
| UFCF | -6,439.2 | 6,386.4 | 3,040.3 | 3,476.7 | 6,730.3 | 8,631.0 | 8,306.4 | 9,483.6 | 10,827.7 | 12,362.2 |
| WACC, % | 9.43 | 9.42 | 9.43 | 9.43 | 9.43 | 9.43 | 9.43 | 9.43 | 9.43 | 9.43 |
| PV UFCF | ||||||||||
| SUM PV UFCF | 37,494.3 | |||||||||
| Long Term Growth Rate, % | 3.00 | |||||||||
| Free cash flow (T + 1) | 12,733 | |||||||||
| Terminal Value | 198,169 | |||||||||
| Present Terminal Value | 126,313 | |||||||||
| Enterprise Value | 163,807 | |||||||||
| Net Debt | -8,122 | |||||||||
| Equity Value | 171,929 | |||||||||
| Diluted Shares Outstanding, MM | 85 | |||||||||
| Equity Value Per Share | 2,014.73 |
What You Will Receive
- Authentic SMS Co. Data: Comprehensive financials – from revenue to EBIT – derived from actual and projected metrics.
- Complete Customization: Modify all key parameters (highlighted cells) such as WACC, growth %, and tax rates.
- Instant Valuation Adjustments: Automatic recalculations to evaluate the effects of changes on SMS Co.’s fair value.
- Flexible Excel Template: Designed for quick modifications, scenario analysis, and in-depth projections.
- Efficient and Precise: Avoid starting from scratch with models while ensuring accuracy and adaptability.
Key Features
- Comprehensive DCF Calculator: Offers in-depth unlevered and levered DCF valuation frameworks.
- WACC Calculator: Comes with a pre-configured Weighted Average Cost of Capital sheet featuring adjustable inputs.
- Customizable Forecast Assumptions: Tailor growth rates, capital expenditures, and discount rates as needed.
- Integrated Financial Ratios: Evaluate profitability, leverage, and efficiency ratios for SMS Co., Ltd. (2175T).
- Interactive Dashboard and Charts: Visual representations summarize essential valuation metrics for straightforward analysis.
How It Works
- Step 1: Download the Excel file for SMS Co., Ltd. (2175T).
- Step 2: Review the pre-filled financial data and forecasts for SMS Co., Ltd. (2175T).
- Step 3: Adjust key inputs such as revenue growth, WACC, and tax rates (highlighted cells).
- Step 4: Observe the DCF model refresh in real-time as you modify the assumptions.
- Step 5: Evaluate the results and utilize the data for your investment strategies.
Why Select SMS Co., Ltd. (2175T)?
- Precision: Leverages real SMS Co., Ltd. (2175T) financials for reliable data.
- Versatility: Tailored for users to easily adjust and experiment with inputs.
- Efficiency: Eliminate the complexity of constructing a financial model from the ground up.
- Expert-Level: Crafted with the accuracy and usability expected by CFOs.
- Intuitive: Simple to navigate, making it accessible for individuals without extensive financial modeling knowledge.
Who Can Benefit from SMS Co., Ltd. (2175T)?
- Individual Investors: Gain insights to make savvy decisions when trading SMS Co., Ltd. (2175T) shares.
- Financial Analysts: Enhance your valuation techniques with comprehensive financial models tailored for SMS Co., Ltd. (2175T).
- Consultants: Provide clients with expert valuation assessments for SMS Co., Ltd. (2175T) in a timely and precise manner.
- Business Owners: Learn the valuation strategies of prominent companies like SMS Co., Ltd. (2175T) to inform your own business plans.
- Finance Students: Master valuation methods through practical applications using data from SMS Co., Ltd. (2175T).
What the Template Includes
- Pre-Filled DCF Model: SMS Co., Ltd.'s (2175T) financial data ready for immediate analysis.
- WACC Calculator: Comprehensive calculations for Weighted Average Cost of Capital.
- Financial Ratios: Assess SMS Co., Ltd.'s profitability, leverage, and operational efficiency.
- Editable Inputs: Modify assumptions like growth rates, margins, and CAPEX to suit your scenarios.
- Financial Statements: Annual and quarterly reports for thorough evaluation.
- Interactive Dashboard: Intuitive visualization of essential valuation metrics and outcomes.
Disclaimer
All information, articles, and product details provided on this website are for general informational and educational purposes only. We do not claim any ownership over, nor do we intend to infringe upon, any trademarks, copyrights, logos, brand names, or other intellectual property mentioned or depicted on this site. Such intellectual property remains the property of its respective owners, and any references here are made solely for identification or informational purposes, without implying any affiliation, endorsement, or partnership.
We make no representations or warranties, express or implied, regarding the accuracy, completeness, or suitability of any content or products presented. Nothing on this website should be construed as legal, tax, investment, financial, medical, or other professional advice. In addition, no part of this site—including articles or product references—constitutes a solicitation, recommendation, endorsement, advertisement, or offer to buy or sell any securities, franchises, or other financial instruments, particularly in jurisdictions where such activity would be unlawful.
All content is of a general nature and may not address the specific circumstances of any individual or entity. It is not a substitute for professional advice or services. Any actions you take based on the information provided here are strictly at your own risk. You accept full responsibility for any decisions or outcomes arising from your use of this website and agree to release us from any liability in connection with your use of, or reliance upon, the content or products found herein.