
|
Persol Holdings Co., Ltd. (2181.T) Avaliação DCF |
Totalmente Editável: Adapte-Se Às Suas Necessidades No Excel Ou Planilhas
Design Profissional: Modelos Confiáveis E Padrão Da Indústria
Pré-Construídos Para Uso Rápido E Eficiente
Compatível com MAC/PC, totalmente desbloqueado
Não É Necessária Experiência; Fácil De Seguir
Persol Holdings Co., Ltd. (2181.T) Bundle
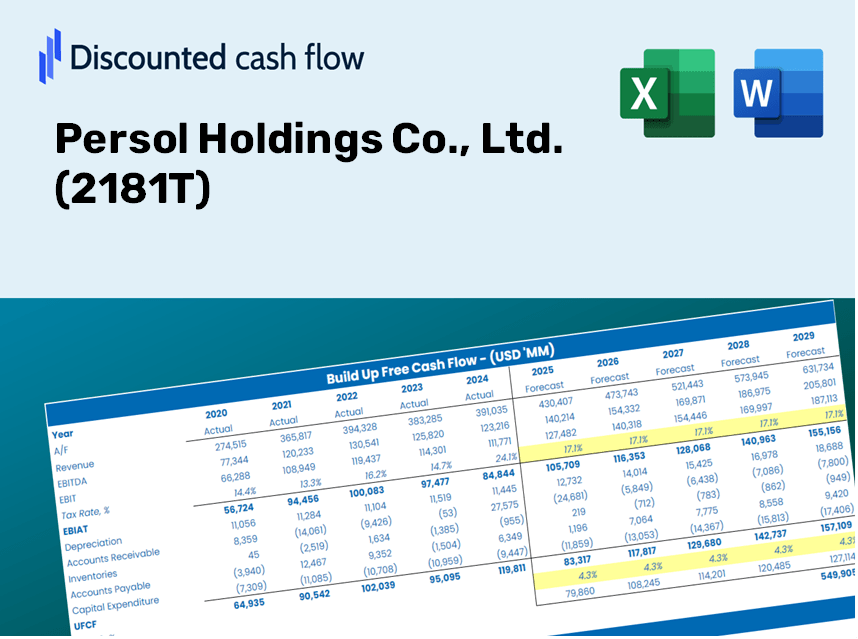
Avalie as perspectivas financeiras da Persol Holdings Co., Ltd. Como um especialista! Esta calculadora (2181T) DCF vem com dados financeiros pré-preenchidos e oferece total flexibilidade para modificar o crescimento da receita, WACC, margens e outras suposições essenciais para se alinhar às suas projeções.
Discounted Cash Flow (DCF) - (USD MM)
| Year | AY1 2021 |
AY2 2022 |
AY3 2023 |
AY4 2024 |
AY5 2025 |
FY1 2026 |
FY2 2027 |
FY3 2028 |
FY4 2029 |
FY5 2030 |
|---|---|---|---|---|---|---|---|---|---|---|
| Revenue | 950,722.0 | 1,060,893.0 | 1,242,611.0 | 1,327,123.0 | 1,451,238.0 | 1,614,031.6 | 1,795,086.7 | 1,996,451.7 | 2,220,405.0 | 2,469,480.4 |
| Revenue Growth, % | 0 | 11.59 | 17.13 | 6.8 | 9.35 | 11.22 | 11.22 | 11.22 | 11.22 | 11.22 |
| EBITDA | 45,658.0 | 69,319.0 | 72,780.0 | 80,060.0 | 92,560.0 | 95,563.9 | 106,283.9 | 118,206.3 | 131,466.2 | 146,213.5 |
| EBITDA, % | 4.8 | 6.53 | 5.86 | 6.03 | 6.38 | 5.92 | 5.92 | 5.92 | 5.92 | 5.92 |
| Depreciation | 17,446.0 | 19,006.0 | 30,315.0 | 29,634.0 | 32,984.0 | 34,126.8 | 37,955.0 | 42,212.7 | 46,947.9 | 52,214.3 |
| Depreciation, % | 1.84 | 1.79 | 2.44 | 2.23 | 2.27 | 2.11 | 2.11 | 2.11 | 2.11 | 2.11 |
| EBIT | 28,212.0 | 50,313.0 | 42,465.0 | 50,426.0 | 59,576.0 | 61,437.1 | 68,328.8 | 75,993.6 | 84,518.3 | 93,999.2 |
| EBIT, % | 2.97 | 4.74 | 3.42 | 3.8 | 4.11 | 3.81 | 3.81 | 3.81 | 3.81 | 3.81 |
| Total Cash | 83,161.0 | 107,545.0 | 101,311.0 | 108,369.0 | 82,818.0 | 132,059.6 | 146,873.5 | 163,349.1 | 181,672.9 | 202,052.2 |
| Total Cash, percent | .0 | .0 | .0 | .0 | .0 | .0 | .0 | .0 | .0 | .0 |
| Account Receivables | 132,335.0 | 168,277.0 | 160,407.0 | 193,434.0 | 205,182.0 | 230,496.5 | 256,352.6 | 285,109.1 | 317,091.4 | 352,661.4 |
| Account Receivables, % | 13.92 | 15.86 | 12.91 | 14.58 | 14.14 | 14.28 | 14.28 | 14.28 | 14.28 | 14.28 |
| Inventories | 8,300.0 | 333.0 | 384.0 | .0 | .0 | 3,019.2 | 3,357.9 | 3,734.6 | 4,153.5 | 4,619.5 |
| Inventories, % | 0.87302 | 0.03138865 | 0.03090267 | 0 | 0 | 0.18706 | 0.18706 | 0.18706 | 0.18706 | 0.18706 |
| Accounts Payable | 451.0 | 630.0 | 602.0 | 95,270.0 | 99,508.0 | 45,808.5 | 50,947.1 | 56,662.2 | 63,018.3 | 70,087.4 |
| Accounts Payable, % | 0.04743763 | 0.05938393 | 0.04844638 | 7.18 | 6.86 | 2.84 | 2.84 | 2.84 | 2.84 | 2.84 |
| Capital Expenditure | -12,235.0 | -10,987.0 | -13,439.0 | -15,486.0 | -5,139.0 | -15,898.4 | -17,681.8 | -19,665.3 | -21,871.3 | -24,324.7 |
| Capital Expenditure, % | -1.29 | -1.04 | -1.08 | -1.17 | -0.35411 | -0.98501 | -0.98501 | -0.98501 | -0.98501 | -0.98501 |
| Tax Rate, % | 37.95 | 37.95 | 37.95 | 37.95 | 37.95 | 37.95 | 37.95 | 37.95 | 37.95 | 37.95 |
| EBITAT | 15,532.6 | 32,078.1 | 23,432.0 | 30,889.9 | 36,967.8 | 36,530.8 | 40,628.7 | 45,186.2 | 50,255.0 | 55,892.4 |
| Depreciation | ||||||||||
| Changes in Account Receivables | ||||||||||
| Changes in Inventories | ||||||||||
| Changes in Accounts Payable | ||||||||||
| Capital Expenditure | ||||||||||
| UFCF | -119,440.4 | 12,301.1 | 48,099.0 | 107,062.9 | 57,302.8 | -27,274.0 | 39,845.7 | 44,315.4 | 49,286.6 | 54,815.3 |
| WACC, % | 6.72 | 6.76 | 6.72 | 6.75 | 6.75 | 6.74 | 6.74 | 6.74 | 6.74 | 6.74 |
| PV UFCF | ||||||||||
| SUM PV UFCF | 123,377.8 | |||||||||
| Long Term Growth Rate, % | 3.00 | |||||||||
| Free cash flow (T + 1) | 56,460 | |||||||||
| Terminal Value | 1,508,629 | |||||||||
| Present Terminal Value | 1,088,671 | |||||||||
| Enterprise Value | 1,212,049 | |||||||||
| Net Debt | -5,538 | |||||||||
| Equity Value | 1,217,587 | |||||||||
| Diluted Shares Outstanding, MM | 2,236 | |||||||||
| Equity Value Per Share | 544.55 |
Benefits You'll Receive
- Actual Persol Financials: Access to both historical and projected data for precise valuation.
- Customizable Parameters: Adjust WACC, tax rates, revenue growth, and capital expenses as needed.
- Real-time Calculations: Intrinsic value and NPV are computed automatically.
- Scenario Exploration: Analyze various scenarios to assess Persol's potential future performance.
- User-Friendly Interface: Designed for professionals but easy enough for newcomers to navigate.
Key Features
- Customizable Financial Inputs: Adjust key metrics such as revenue growth, operating margin, and capital investments.
- Instant DCF Valuation: Automatically computes intrinsic value, net present value (NPV), and other financial metrics.
- High Precision Accuracy: Leverages Persol Holdings Co., Ltd.'s (2181T) actual financial data for reliable valuation insights.
- Effortless Scenario Analysis: Experiment with various assumptions and easily compare the resulting outcomes.
- Efficient Valuation Tool: Streamlines the valuation process, eliminating the need to construct complex models from the ground up.
How It Functions
- Step 1: Download the Excel spreadsheet.
- Step 2: Review the pre-loaded data for Persol Holdings Co., Ltd. (2181T), including historical and forecasted figures.
- Step 3: Modify the key assumptions (highlighted in yellow) according to your analysis.
- Step 4: Observe the automatic recalculations for Persol Holdings Co., Ltd.'s (2181T) intrinsic value.
- Step 5: Utilize the results for your investment decisions or reporting needs.
Why Choose Persol Holdings Co., Ltd. ([2181T]) Calculator?
- Comprehensive Tool: Features DCF, WACC, and financial ratio analyses in one convenient package.
- Customizable Inputs: Modify yellow-highlighted cells to explore different scenarios.
- In-Depth Insights: Automatically computes Persol Holdings’ intrinsic value and Net Present Value.
- Preloaded Data: Historical and forecasted information provides reliable starting points.
- Professional Quality: Perfect for financial analysts, investors, and business consultants.
Who Can Benefit from This Product?
- Investors: Make informed decisions by accurately assessing the fair value of Persol Holdings Co., Ltd. (2181T).
- CFOs: Utilize a sophisticated DCF model for precise financial reporting and analysis.
- Consultants: Easily customize the template for client valuation reports.
- Entrepreneurs: Acquire knowledge of financial modeling practices employed by top-tier companies.
- Educators: Employ this tool to illustrate various valuation techniques in the classroom.
Contents of the Template
- Preloaded 2181T Data: Historical and projected financial metrics, including revenue, EBIT, and capital expenditures.
- DCF and WACC Models: Advanced sheets designed for calculating intrinsic value and Weighted Average Cost of Capital.
- Editable Inputs: Yellow-highlighted fields for modifying revenue growth, tax rates, and discount rates.
- Financial Statements: Detailed annual and quarterly financial reports for enhanced analysis.
- Key Ratios: Ratios assessing profitability, leverage, and efficiency for performance evaluation.
- Dashboard and Charts: Visual summaries depicting valuation results and underlying assumptions.
Disclaimer
All information, articles, and product details provided on this website are for general informational and educational purposes only. We do not claim any ownership over, nor do we intend to infringe upon, any trademarks, copyrights, logos, brand names, or other intellectual property mentioned or depicted on this site. Such intellectual property remains the property of its respective owners, and any references here are made solely for identification or informational purposes, without implying any affiliation, endorsement, or partnership.
We make no representations or warranties, express or implied, regarding the accuracy, completeness, or suitability of any content or products presented. Nothing on this website should be construed as legal, tax, investment, financial, medical, or other professional advice. In addition, no part of this site—including articles or product references—constitutes a solicitation, recommendation, endorsement, advertisement, or offer to buy or sell any securities, franchises, or other financial instruments, particularly in jurisdictions where such activity would be unlawful.
All content is of a general nature and may not address the specific circumstances of any individual or entity. It is not a substitute for professional advice or services. Any actions you take based on the information provided here are strictly at your own risk. You accept full responsibility for any decisions or outcomes arising from your use of this website and agree to release us from any liability in connection with your use of, or reliance upon, the content or products found herein.