
|
Morinaga & Co., Ltd. (2201.T) Avaliação DCF |
Totalmente Editável: Adapte-Se Às Suas Necessidades No Excel Ou Planilhas
Design Profissional: Modelos Confiáveis E Padrão Da Indústria
Pré-Construídos Para Uso Rápido E Eficiente
Compatível com MAC/PC, totalmente desbloqueado
Não É Necessária Experiência; Fácil De Seguir
Morinaga&Co., Ltd. (2201.T) Bundle
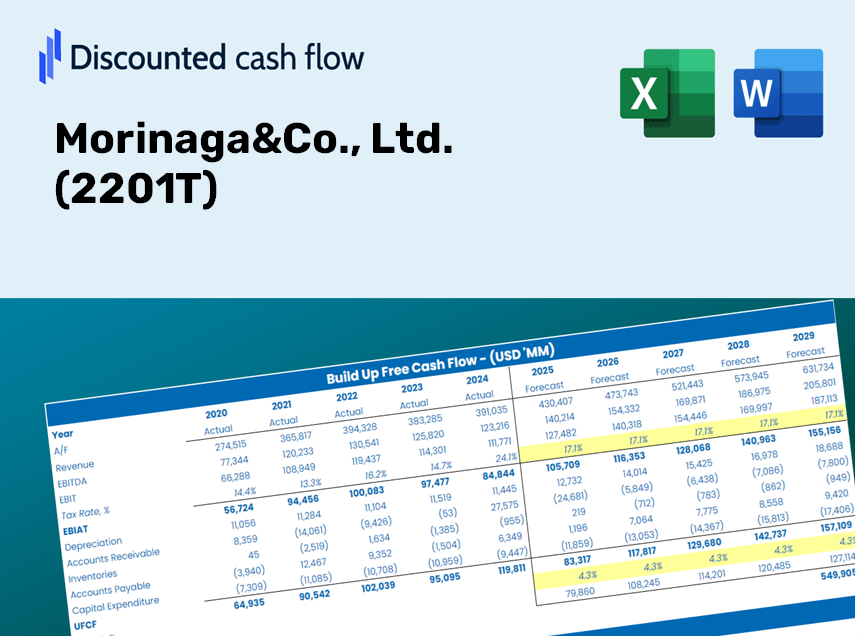
Projetado para precisão, nossa calculadora DCF (2201T) permite avaliar a Avaliação Morinaga & Co., Ltd. Usando dados financeiros atualizados e oferece flexibilidade completa para modificar todos os parâmetros essenciais para melhorar as projeções.
What You Will Receive
- Genuine (2201T) Financial Data: Pre-populated with Morinaga&Co., Ltd.'s historical and projected figures for thorough analysis.
- Fully Customizable Template: Effortlessly adjust key inputs such as revenue growth, WACC, and EBITDA percentage.
- Instantaneous Calculations: Watch the intrinsic value of Morinaga&Co., Ltd. update in real-time as you make changes.
- Professional Valuation Tool: Tailored for investors, analysts, and consultants aiming for precise DCF outcomes.
- User-Friendly Interface: Intuitive layout and straightforward instructions suitable for all skill levels.
Key Features
- Comprehensive DCF Calculator: Features in-depth unlevered and levered DCF valuation models tailored for Morinaga&Co., Ltd. (2201T).
- WACC Calculator: Ready-to-use Weighted Average Cost of Capital sheet with adjustable inputs specific to the needs of Morinaga&Co., Ltd. (2201T).
- Customizable Forecast Assumptions: Easily adjust growth projections, capital expenditures, and discount rates to fit Morinaga&Co., Ltd. (2201T).
- Integrated Financial Ratios: Evaluate profitability, leverage, and efficiency metrics relevant to Morinaga&Co., Ltd. (2201T).
- Interactive Dashboard and Charts: Visual representations that distill essential valuation metrics for straightforward analysis pertaining to Morinaga&Co., Ltd. (2201T).
How It Works
- Download: Obtain the ready-to-use Excel file featuring Morinaga&Co., Ltd. (2201T) financial data.
- Customize: Tailor forecasts, such as revenue growth, EBITDA %, and WACC, to suit your analysis.
- Update Automatically: Experience real-time updates for intrinsic value and NPV calculations.
- Test Scenarios: Generate various projections and compare results instantly.
- Make Decisions: Leverage the valuation insights to inform your investment approach.
Why Choose This Calculator for Morinaga&Co., Ltd. (2201T)?
- Precise Financials: Utilize accurate Morinaga&Co. financial data for trustworthy valuation outcomes.
- Tailored Options: Modify essential variables such as growth rates, WACC, and tax rates to fit your forecasts.
- Efficient: Built-in calculations save you the effort of starting from the ground up.
- Expert-Level Tool: Crafted for investors, analysts, and consultants focusing on Morinaga&Co.
- Easy to Use: User-friendly design and clear, step-by-step guidance cater to all experience levels.
Who Can Benefit from This Product?
- Investors: Accurately assess Morinaga&Co., Ltd.'s (2201T) fair value prior to making investment choices.
- CFOs: Utilize a high-quality DCF model for enhanced financial reporting and analysis.
- Consultants: Efficiently modify the template for client valuation reports.
- Entrepreneurs: Acquire insights into the financial modeling techniques employed by leading companies.
- Educators: Implement it as a teaching aid to illustrate valuation methodologies.
Overview of the Template Components
- Preloaded Morinaga&Co., Ltd. Data: Comprehensive historical and forecasted financial metrics, including revenue, EBIT, and capital expenditures.
- DCF and WACC Models: Advanced spreadsheets designed for calculating intrinsic value and Weighted Average Cost of Capital.
- Customizable Inputs: Cells highlighted in yellow for modifying revenue growth rates, tax percentages, and discount rates.
- Financial Statements: Detailed annual and quarterly financial reports for in-depth analysis.
- Key Ratios: Essential profitability, leverage, and efficiency ratios for performance assessment.
- Dashboard and Charts: Visual representations of valuation results and underlying assumptions.
Disclaimer
All information, articles, and product details provided on this website are for general informational and educational purposes only. We do not claim any ownership over, nor do we intend to infringe upon, any trademarks, copyrights, logos, brand names, or other intellectual property mentioned or depicted on this site. Such intellectual property remains the property of its respective owners, and any references here are made solely for identification or informational purposes, without implying any affiliation, endorsement, or partnership.
We make no representations or warranties, express or implied, regarding the accuracy, completeness, or suitability of any content or products presented. Nothing on this website should be construed as legal, tax, investment, financial, medical, or other professional advice. In addition, no part of this site—including articles or product references—constitutes a solicitation, recommendation, endorsement, advertisement, or offer to buy or sell any securities, franchises, or other financial instruments, particularly in jurisdictions where such activity would be unlawful.
All content is of a general nature and may not address the specific circumstances of any individual or entity. It is not a substitute for professional advice or services. Any actions you take based on the information provided here are strictly at your own risk. You accept full responsibility for any decisions or outcomes arising from your use of this website and agree to release us from any liability in connection with your use of, or reliance upon, the content or products found herein.