
|
Calbee, Inc. (2229.T) Avaliação DCF |
Totalmente Editável: Adapte-Se Às Suas Necessidades No Excel Ou Planilhas
Design Profissional: Modelos Confiáveis E Padrão Da Indústria
Pré-Construídos Para Uso Rápido E Eficiente
Compatível com MAC/PC, totalmente desbloqueado
Não É Necessária Experiência; Fácil De Seguir
Calbee, Inc. (2229.T) Bundle
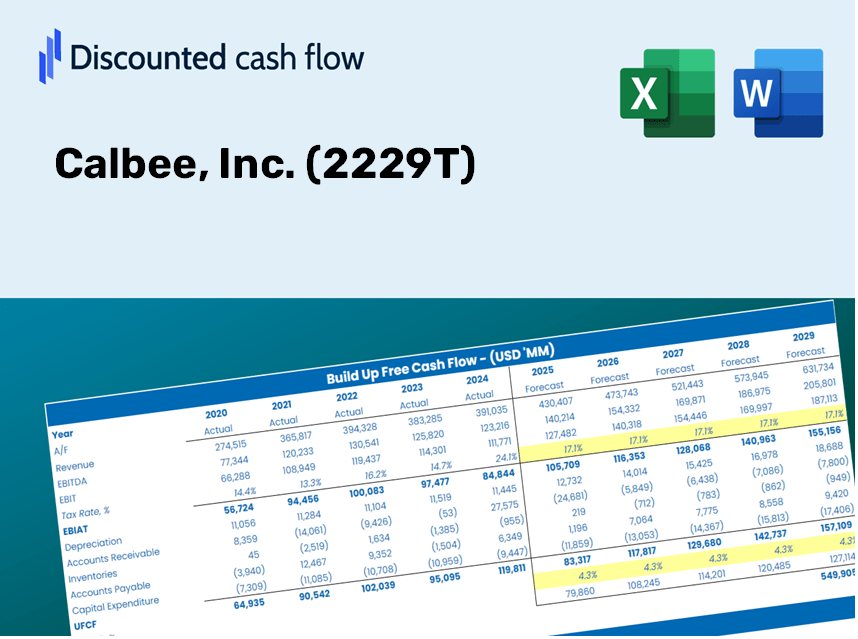
Olhando para avaliar o valor intrínseco da Calbee, Inc.? Nossa calculadora DCF (2229T) integra dados do mundo real com extensos recursos de personalização, permitindo refinar as previsões e aprimorar suas opções de investimento.
What You Will Receive
- Flexible Forecast Inputs: Adjust key assumptions (growth %, margins, WACC) effortlessly to explore various scenarios.
- Current Financial Data: Calbee, Inc.'s financial information is pre-loaded to kickstart your assessment.
- Instant DCF Outputs: The template computes Net Present Value (NPV) and intrinsic value automatically.
- Tailored and Professional Design: A sleek Excel model that can be customized to meet your valuation requirements.
- Designed for Analysts and Investors: Perfect for evaluating projections, confirming strategies, and optimizing your time.
Key Features
- Advanced DCF Calculator: Features comprehensive unlevered and levered DCF valuation models tailored for Calbee, Inc. (2229T).
- WACC Calculator: Comes with a pre-built Weighted Average Cost of Capital sheet that allows for customizable inputs specific to Calbee, Inc. (2229T).
- Editable Forecast Assumptions: Adjust growth rates, capital expenditures, and discount rates to fit Calbee, Inc. (2229T) projections.
- Built-In Financial Ratios: Evaluate profitability, leverage, and efficiency ratios relevant to Calbee, Inc. (2229T).
- Dashboard and Charts: Visual representations that clearly summarize key valuation metrics for straightforward analysis of Calbee, Inc. (2229T).
How It Works
- Step 1: Download the ready-to-use Excel template featuring Calbee, Inc. (2229T) data.
- Step 2: Review the pre-populated sheets to familiarize yourself with the essential metrics.
- Step 3: Adjust forecasts and assumptions in the editable yellow cells (WACC, growth, margins).
- Step 4: Quickly access the updated results, including Calbee, Inc.'s (2229T) intrinsic value.
- Step 5: Utilize the outputs to make well-informed investment choices or create reports.
Why Choose Calbee, Inc. (2229T)?
- Save Time: Skip the hassle of building a valuation model from the ground up – it’s ready for immediate use.
- Enhance Accuracy: Utilize trustworthy financial information and calculations to minimize valuation errors.
- Fully Customizable: Adjust the model to align with your specific assumptions and forecasts.
- Simple to Analyze: Intuitive charts and outputs ensure results are straightforward to interpret.
- Endorsed by Professionals: Constructed for experts who prioritize both accuracy and user-friendliness.
Who Can Benefit from This Product?
- Finance Students: Master valuation techniques and apply them using actual data pertinent to Calbee, Inc. (2229T).
- Academics: Integrate industry-standard models into your teaching or research involving Calbee, Inc. (2229T).
- Investors: Evaluate your assumptions and analyze valuation results for Calbee, Inc. (2229T) stock.
- Analysts: Enhance your efficiency with a customizable DCF model designed for Calbee, Inc. (2229T).
- Small Business Owners: Discover how major public companies like Calbee, Inc. (2229T) are assessed in the market.
Contents of the Template
- Preloaded Calbee Data: Historical and forecasted financial metrics, including revenue, EBIT, and capital expenditures.
- DCF and WACC Models: Advanced spreadsheets for determining intrinsic value and Weighted Average Cost of Capital.
- Editable Inputs: Cells highlighted in yellow for modifying revenue growth, tax rates, and discount rates.
- Financial Statements: Detailed annual and quarterly financial reports for extensive analysis.
- Key Ratios: Analysis of profitability, leverage, and efficiency ratios to assess performance.
- Dashboard and Charts: Visual representations of valuation results and underlying assumptions.
Disclaimer
All information, articles, and product details provided on this website are for general informational and educational purposes only. We do not claim any ownership over, nor do we intend to infringe upon, any trademarks, copyrights, logos, brand names, or other intellectual property mentioned or depicted on this site. Such intellectual property remains the property of its respective owners, and any references here are made solely for identification or informational purposes, without implying any affiliation, endorsement, or partnership.
We make no representations or warranties, express or implied, regarding the accuracy, completeness, or suitability of any content or products presented. Nothing on this website should be construed as legal, tax, investment, financial, medical, or other professional advice. In addition, no part of this site—including articles or product references—constitutes a solicitation, recommendation, endorsement, advertisement, or offer to buy or sell any securities, franchises, or other financial instruments, particularly in jurisdictions where such activity would be unlawful.
All content is of a general nature and may not address the specific circumstances of any individual or entity. It is not a substitute for professional advice or services. Any actions you take based on the information provided here are strictly at your own risk. You accept full responsibility for any decisions or outcomes arising from your use of this website and agree to release us from any liability in connection with your use of, or reliance upon, the content or products found herein.