
|
West China Cement Limited (2233.HK) Avaliação DCF |
Totalmente Editável: Adapte-Se Às Suas Necessidades No Excel Ou Planilhas
Design Profissional: Modelos Confiáveis E Padrão Da Indústria
Pré-Construídos Para Uso Rápido E Eficiente
Compatível com MAC/PC, totalmente desbloqueado
Não É Necessária Experiência; Fácil De Seguir
West China Cement Limited (2233.HK) Bundle
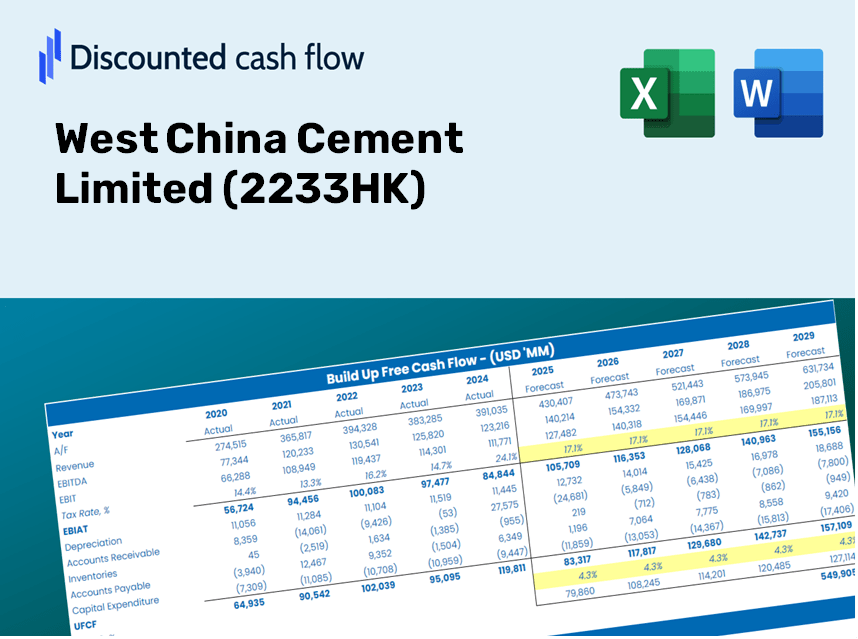
Obtenha informações sobre a análise de avaliação da West China Cement Limited (2233HK) com nossa calculadora DCF de última geração! Este modelo do Excel é pré -carregado com dados reais (2233HK), permitindo que você ajuste as previsões e suposições para um cálculo preciso do valor intrínseco da West China Cement Limited.
Discounted Cash Flow (DCF) - (USD MM)
| Year | AY1 2020 |
AY2 2021 |
AY3 2022 |
AY4 2023 |
AY5 2024 |
FY1 2025 |
FY2 2026 |
FY3 2027 |
FY4 2028 |
FY5 2029 |
|---|---|---|---|---|---|---|---|---|---|---|
| Revenue | 7,797.1 | 8,750.2 | 9,282.0 | 9,863.4 | 9,124.3 | 9,513.8 | 9,919.9 | 10,343.2 | 10,784.7 | 11,245.0 |
| Revenue Growth, % | 0 | 12.22 | 6.08 | 6.26 | -7.49 | 4.27 | 4.27 | 4.27 | 4.27 | 4.27 |
| EBITDA | 3,186.6 | 3,749.8 | 3,520.5 | 2,866.0 | 2,543.5 | 3,398.0 | 3,543.0 | 3,694.3 | 3,851.9 | 4,016.4 |
| EBITDA, % | 40.87 | 42.85 | 37.93 | 29.06 | 27.88 | 35.72 | 35.72 | 35.72 | 35.72 | 35.72 |
| Depreciation | 986.0 | 1,186.1 | 1,410.4 | 1,485.9 | 1,433.7 | 1,373.3 | 1,431.9 | 1,493.0 | 1,556.8 | 1,623.2 |
| Depreciation, % | 12.65 | 13.56 | 15.19 | 15.07 | 15.71 | 14.43 | 14.43 | 14.43 | 14.43 | 14.43 |
| EBIT | 2,200.6 | 2,563.7 | 2,110.2 | 1,380.0 | 1,109.7 | 2,024.7 | 2,111.1 | 2,201.2 | 2,295.2 | 2,393.2 |
| EBIT, % | 28.22 | 29.3 | 22.73 | 13.99 | 12.16 | 21.28 | 21.28 | 21.28 | 21.28 | 21.28 |
| Total Cash | 821.6 | 3,924.8 | 1,557.3 | 1,008.8 | 1,265.2 | 1,831.7 | 1,909.8 | 1,991.4 | 2,076.4 | 2,165.0 |
| Total Cash, percent | .0 | .0 | .0 | .0 | .0 | .0 | .0 | .0 | .0 | .0 |
| Account Receivables | 2,879.4 | 3,112.4 | 2,822.7 | 1,529.1 | 3,275.5 | 2,936.1 | 3,061.5 | 3,192.1 | 3,328.4 | 3,470.4 |
| Account Receivables, % | 36.93 | 35.57 | 30.41 | 15.5 | 35.9 | 30.86 | 30.86 | 30.86 | 30.86 | 30.86 |
| Inventories | 799.7 | 1,215.0 | 1,627.9 | 2,561.6 | 3,429.4 | 2,002.4 | 2,087.8 | 2,176.9 | 2,269.9 | 2,366.7 |
| Inventories, % | 10.26 | 13.88 | 17.54 | 25.97 | 37.58 | 21.05 | 21.05 | 21.05 | 21.05 | 21.05 |
| Accounts Payable | 2,008.3 | 2,168.8 | 2,273.4 | 2,491.9 | 2,869.6 | 2,506.9 | 2,613.9 | 2,725.4 | 2,841.8 | 2,963.0 |
| Accounts Payable, % | 25.76 | 24.79 | 24.49 | 25.26 | 31.45 | 26.35 | 26.35 | 26.35 | 26.35 | 26.35 |
| Capital Expenditure | -3,216.6 | -4,149.1 | -3,237.9 | -3,197.3 | -2,421.7 | -3,472.8 | -3,621.0 | -3,775.5 | -3,936.7 | -4,104.7 |
| Capital Expenditure, % | -41.25 | -47.42 | -34.88 | -32.42 | -26.54 | -36.5 | -36.5 | -36.5 | -36.5 | -36.5 |
| Tax Rate, % | 42.56 | 42.56 | 42.56 | 42.56 | 42.56 | 42.56 | 42.56 | 42.56 | 42.56 | 42.56 |
| EBITAT | 1,858.8 | 1,950.3 | 1,693.9 | 609.2 | 637.4 | 1,386.5 | 1,445.7 | 1,507.4 | 1,571.7 | 1,638.8 |
| Depreciation | ||||||||||
| Changes in Account Receivables | ||||||||||
| Changes in Inventories | ||||||||||
| Changes in Accounts Payable | ||||||||||
| Capital Expenditure | ||||||||||
| UFCF | -2,042.6 | -1,500.5 | -152.3 | -523.6 | -2,587.2 | 690.7 | -847.2 | -883.3 | -921.0 | -960.3 |
| WACC, % | 5.07 | 4.93 | 5 | 4.42 | 4.63 | 4.81 | 4.81 | 4.81 | 4.81 | 4.81 |
| PV UFCF | ||||||||||
| SUM PV UFCF | -2,401.8 | |||||||||
| Long Term Growth Rate, % | 0.50 | |||||||||
| Free cash flow (T + 1) | -965 | |||||||||
| Terminal Value | -22,389 | |||||||||
| Present Terminal Value | -17,701 | |||||||||
| Enterprise Value | -20,103 | |||||||||
| Net Debt | 11,374 | |||||||||
| Equity Value | -31,476 | |||||||||
| Diluted Shares Outstanding, MM | 5,451 | |||||||||
| Equity Value Per Share | -5.77 |
What You Will Receive
- Genuine West China Cement Data: Comprehensive financials – covering everything from revenue to EBIT – based on actual and projected metrics.
- Complete Customization: Modify all essential parameters (highlighted cells) such as WACC, growth %, and tax rates as needed.
- Real-Time Valuation Updates: Automatic recalculations to assess how changes affect the fair value of West China Cement Limited (2233HK).
- Flexible Excel Template: Designed for easy adjustments, scenario analysis, and thorough projections.
- Efficient and Accurate: Eliminate the need to build models from the ground up while ensuring accuracy and adaptability.
Key Features
- Comprehensive 2233HK Data: Pre-loaded with West China Cement's historical financials and future projections.
- Fully Customizable Variables: Tailor revenue growth, profit margins, WACC, tax rates, and capital expenditures to your needs.
- Dynamic Valuation Framework: Automated adjustments to Net Present Value (NPV) and intrinsic value based on your parameters.
- Scenario Analysis: Generate various forecasting scenarios to evaluate different valuation results.
- User-Friendly Interface: Intuitive and organized layout suitable for both professionals and newcomers.
How It Works
- Step 1: Download the Excel file for West China Cement Limited (2233HK).
- Step 2: Review the pre-filled financial data and forecasts for West China Cement Limited (2233HK).
- Step 3: Adjust key inputs such as revenue growth, WACC, and tax rates (highlighted cells).
- Step 4: Observe the DCF model update in real-time as you adjust your assumptions.
- Step 5: Evaluate the outputs and leverage the findings for your investment strategies.
Why Opt for West China Cement Limited (2233HK)?
- Time Efficient: Skip the hassle of building a DCF model from the ground up – our tools are immediately accessible.
- Enhanced Precision: Dependable financial data and calculations minimize valuation inaccuracies.
- Completely Customizable: Adjust the model to align with your unique assumptions and forecasts.
- User-Friendly: Intuitive charts and outputs simplify the analysis of results.
- Preferred by Industry Experts: Crafted for professionals who prioritize accuracy and ease of use.
Who Can Benefit from West China Cement Limited (2233HK)?
- Individual Investors: Gain insights to make informed decisions regarding the purchase or sale of West China Cement Limited (2233HK) shares.
- Financial Analysts: Enhance your valuation processes with comprehensive financial models tailored for West China Cement Limited (2233HK).
- Consultants: Provide your clients with prompt and accurate valuation analyses of West China Cement Limited (2233HK).
- Business Owners: Learn about the valuation metrics of major companies like West China Cement Limited (2233HK) to inform your own business strategy.
- Finance Students: Master valuation techniques using practical data and cases from West China Cement Limited (2233HK).
Contents of the Template
- Preloaded WCC Data: Historical and projected financial information, encompassing revenue, EBIT, and capital expenditures.
- DCF and WACC Models: Advanced spreadsheets designed for estimating intrinsic value and calculating Weighted Average Cost of Capital.
- Editable Inputs: Highlighted yellow cells for modifying revenue growth, tax rates, and discount rates.
- Financial Statements: Detailed annual and quarterly financials for thorough analysis.
- Key Ratios: Metrics for profitability, leverage, and efficiency to assess performance.
- Dashboard and Charts: Visual representations of valuation results and underlying assumptions.
Disclaimer
All information, articles, and product details provided on this website are for general informational and educational purposes only. We do not claim any ownership over, nor do we intend to infringe upon, any trademarks, copyrights, logos, brand names, or other intellectual property mentioned or depicted on this site. Such intellectual property remains the property of its respective owners, and any references here are made solely for identification or informational purposes, without implying any affiliation, endorsement, or partnership.
We make no representations or warranties, express or implied, regarding the accuracy, completeness, or suitability of any content or products presented. Nothing on this website should be construed as legal, tax, investment, financial, medical, or other professional advice. In addition, no part of this site—including articles or product references—constitutes a solicitation, recommendation, endorsement, advertisement, or offer to buy or sell any securities, franchises, or other financial instruments, particularly in jurisdictions where such activity would be unlawful.
All content is of a general nature and may not address the specific circumstances of any individual or entity. It is not a substitute for professional advice or services. Any actions you take based on the information provided here are strictly at your own risk. You accept full responsibility for any decisions or outcomes arising from your use of this website and agree to release us from any liability in connection with your use of, or reliance upon, the content or products found herein.