
|
Morinaga Milk Industry Co., Ltd. (2264.T) Avaliação DCF |
Totalmente Editável: Adapte-Se Às Suas Necessidades No Excel Ou Planilhas
Design Profissional: Modelos Confiáveis E Padrão Da Indústria
Pré-Construídos Para Uso Rápido E Eficiente
Compatível com MAC/PC, totalmente desbloqueado
Não É Necessária Experiência; Fácil De Seguir
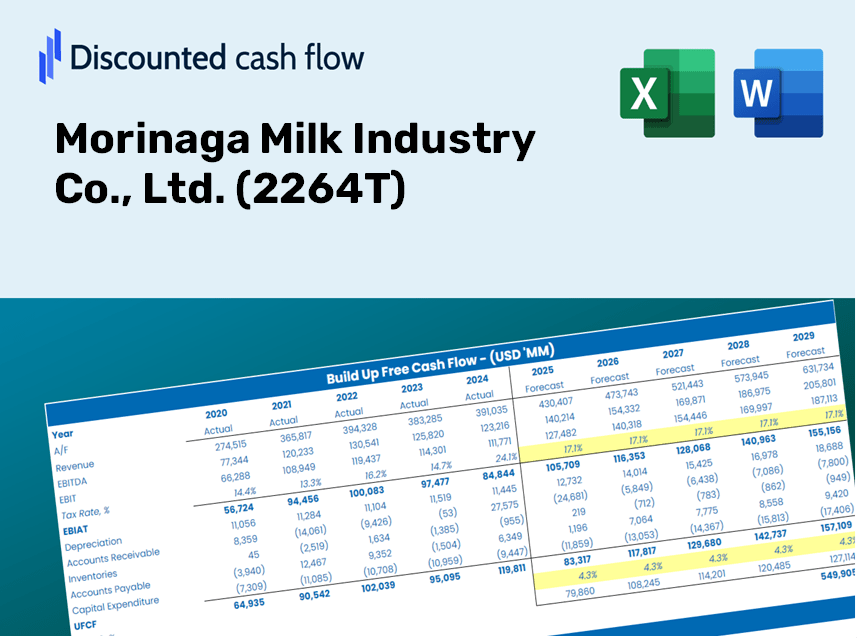
Morinaga Milk Industry Co., Ltd. (2264.T) Bundle
Aprimore suas estratégias de investimento com a calculadora DCF (2264T)! Explore a autêntica Morinaga Milk Industry Co., Ltd. Financeiras, ajuste as projeções e despesas de crescimento e observe instantaneamente como essas mudanças afetam o valor intrínseco de (2264T).
Benefits You Will Receive
- Adjustable Forecast Parameters: Effortlessly modify assumptions (growth %, profit margins, WACC) to explore various scenarios.
- Industry-Specific Data: Pre-populated financial information for Morinaga Milk Industry Co., Ltd. (2264T) to kickstart your analysis.
- Instant DCF Calculations: The template automatically computes Net Present Value (NPV) and intrinsic value for you.
- Tailored and Professional Design: A sleek Excel model that customizes to fit your valuation requirements.
- Designed for Analysts and Investors: Perfect for evaluating projections, confirming strategies, and increasing efficiency.
Key Features of Morinaga Milk Industry Co., Ltd. (2264T)
- Genuine Financial Insights: Gain access to reliable pre-loaded historical data and future forecasts.
- Tailorable Forecast Parameters: Modify yellow-highlighted fields such as WACC, growth rates, and profit margins.
- Real-Time Calculations: Enjoy automatic updates for DCF, Net Present Value (NPV), and cash flow analyses.
- User-Friendly Dashboard: Clear charts and summaries to help you interpret your valuation findings effortlessly.
- Designed for All Skill Levels: A straightforward, intuitive layout suitable for investors, CFOs, and consultants alike.
How It Functions
- Download the Template: Gain immediate access to the Excel-based Morinaga Milk DCF Calculator.
- Input Your Assumptions: Modify the yellow-highlighted cells for growth rates, WACC, margins, and other variables.
- Instant Calculations: The model automatically refreshes Morinaga Milk's intrinsic value.
- Test Scenarios: Experiment with various assumptions to assess potential valuation shifts.
- Analyze and Decide: Leverage the results to inform your investment or financial analysis.
Why Choose Morinaga Milk Industry Co., Ltd. ([2264T]) Calculator?
- Precision: Authentic Morinaga financial data guarantees reliable results.
- Adaptability: Crafted for users to experiment and adjust inputs with ease.
- Efficiency: Eliminate the complexities of creating a financial model from the ground up.
- Expert Quality: Designed with the expertise and detail expected at the CFO level.
- Intuitive Interface: Simple to navigate, even for those with limited financial modeling skills.
Who Can Benefit from Morinaga Milk Industry Co., Ltd. (2264T)?
- Investors: Make well-informed decisions with a premium valuation tool tailored for industry insights.
- Financial Analysts: Streamline your analysis process with a ready-to-customize DCF model.
- Consultants: Effortlessly modify the template for impactful client presentations or reports.
- Dairy Industry Enthusiasts: Enhance your knowledge of valuation methods through practical examples from the dairy sector.
- Educators and Students: Utilize this resource as a hands-on learning tool in finance or business courses.
Overview of Template Features
- Comprehensive DCF Model: Editable template featuring detailed valuation calculations.
- Real-World Data: Morinaga Milk Industry Co., Ltd. (2264T)’s historical and projected financials preloaded for analysis.
- Customizable Parameters: Modify WACC, growth rates, and tax assumptions to explore various scenarios.
- Financial Statements: Complete annual and quarterly breakdowns for in-depth insights.
- Key Ratios: Integrated analysis for evaluating profitability, efficiency, and leverage.
- Dashboard with Visual Outputs: Charts and tables designed for delivering clear, actionable results.
Disclaimer
All information, articles, and product details provided on this website are for general informational and educational purposes only. We do not claim any ownership over, nor do we intend to infringe upon, any trademarks, copyrights, logos, brand names, or other intellectual property mentioned or depicted on this site. Such intellectual property remains the property of its respective owners, and any references here are made solely for identification or informational purposes, without implying any affiliation, endorsement, or partnership.
We make no representations or warranties, express or implied, regarding the accuracy, completeness, or suitability of any content or products presented. Nothing on this website should be construed as legal, tax, investment, financial, medical, or other professional advice. In addition, no part of this site—including articles or product references—constitutes a solicitation, recommendation, endorsement, advertisement, or offer to buy or sell any securities, franchises, or other financial instruments, particularly in jurisdictions where such activity would be unlawful.
All content is of a general nature and may not address the specific circumstances of any individual or entity. It is not a substitute for professional advice or services. Any actions you take based on the information provided here are strictly at your own risk. You accept full responsibility for any decisions or outcomes arising from your use of this website and agree to release us from any liability in connection with your use of, or reliance upon, the content or products found herein.