
|
Yakult Honsha Co., Ltd. (2267.T) Avaliação DCF |
Totalmente Editável: Adapte-Se Às Suas Necessidades No Excel Ou Planilhas
Design Profissional: Modelos Confiáveis E Padrão Da Indústria
Pré-Construídos Para Uso Rápido E Eficiente
Compatível com MAC/PC, totalmente desbloqueado
Não É Necessária Experiência; Fácil De Seguir
Yakult Honsha Co.,Ltd. (2267.T) Bundle
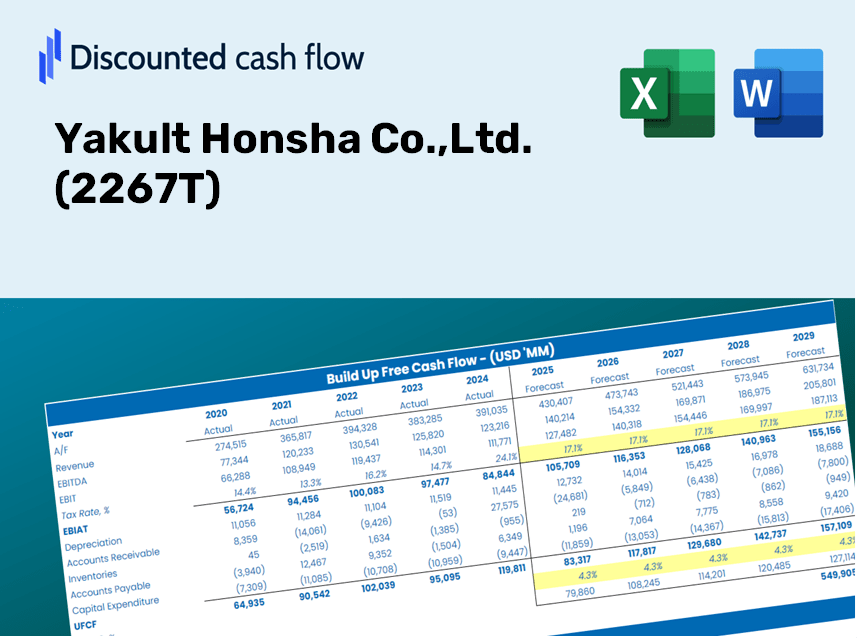
Explore o potencial financeiro da Yakult Honsha Co., Ltd. (2267T) com nossa calculadora DCF amigável! Digite suas previsões de crescimento, margens e despesas para calcular o valor intrínseco da Yakult Honsha Co., Ltd. (2267T) e refine sua estratégia de investimento.
What You Will Receive
- Customizable Forecast Inputs: Effortlessly adjust key assumptions (growth %, margins, WACC) to explore different scenarios.
- Real-World Data: Yakult Honsha Co., Ltd.'s financial information pre-loaded to kickstart your analysis.
- Automated DCF Outputs: The template computes Net Present Value (NPV) and intrinsic value automatically.
- Sleek and Adaptable: A refined Excel model tailored to meet your valuation requirements.
- Designed for Analysts and Investors: Perfect for assessing projections, validating strategies, and optimizing efficiency.
Key Features
- Pre-Loaded Data: Yakult Honsha's historical financial statements and pre-filled forecasts.
- Fully Adjustable Inputs: Modify WACC, tax rates, revenue growth, and EBITDA margins as needed.
- Instant Results: Observe Yakult Honsha's intrinsic value recalculating in real time.
- Clear Visual Outputs: Intuitive dashboard charts present valuation results and essential metrics.
- Built for Accuracy: A reliable tool designed for analysts, investors, and finance professionals.
How It Works
- Step 1: Download the Excel file.
- Step 2: Review the pre-filled Yakult Honsha data (historical and projected).
- Step 3: Modify key assumptions (highlighted in yellow) according to your analysis.
- Step 4: Observe automatic recalculations for Yakult Honsha's intrinsic value.
- Step 5: Utilize the results for your investment choices or reporting needs.
Why Choose This Calculator?
- Designed for Experts: A sophisticated tool utilized by analysts, CFOs, and industry consultants.
- Real-World Data: Yakult Honsha Co., Ltd.’s historical and projected financial figures are preloaded for precision.
- Scenario Analysis: Effortlessly test various forecasts and assumptions.
- Transparent Outputs: Automatically computes intrinsic value, NPV, and essential metrics.
- User-Friendly: Comprehensive step-by-step guidance ensures a smooth experience.
Who Should Consider Using This Product?
- Professional Investors: Develop comprehensive and reliable valuation models for evaluating opportunities in Yakult Honsha Co., Ltd. (2267T).
- Corporate Finance Teams: Assess valuation scenarios to inform strategic decisions within their organizations.
- Consultants and Advisors: Offer clients precise valuation insights related to Yakult Honsha Co., Ltd. (2267T).
- Students and Educators: Utilize real-world data to enhance learning and practice in financial modeling.
- Health and Wellness Enthusiasts: Gain insights into how companies like Yakult are valued in the health industry.
Contents of the Yakult Honsha Template
- Preloaded 2267T Data: Historical and projected financial data, including revenue, EBIT, and capital expenditures.
- DCF and WACC Models: Professional-grade sheets designed for calculating intrinsic value and Weighted Average Cost of Capital.
- Editable Inputs: Cells highlighted in yellow for customizing revenue growth, tax rates, and discount rates.
- Financial Statements: Detailed annual and quarterly financials for in-depth analysis.
- Key Ratios: Profitability, leverage, and efficiency ratios for performance evaluation.
- Dashboard and Charts: Visual representations of valuation outcomes and underlying assumptions.
Disclaimer
All information, articles, and product details provided on this website are for general informational and educational purposes only. We do not claim any ownership over, nor do we intend to infringe upon, any trademarks, copyrights, logos, brand names, or other intellectual property mentioned or depicted on this site. Such intellectual property remains the property of its respective owners, and any references here are made solely for identification or informational purposes, without implying any affiliation, endorsement, or partnership.
We make no representations or warranties, express or implied, regarding the accuracy, completeness, or suitability of any content or products presented. Nothing on this website should be construed as legal, tax, investment, financial, medical, or other professional advice. In addition, no part of this site—including articles or product references—constitutes a solicitation, recommendation, endorsement, advertisement, or offer to buy or sell any securities, franchises, or other financial instruments, particularly in jurisdictions where such activity would be unlawful.
All content is of a general nature and may not address the specific circumstances of any individual or entity. It is not a substitute for professional advice or services. Any actions you take based on the information provided here are strictly at your own risk. You accept full responsibility for any decisions or outcomes arising from your use of this website and agree to release us from any liability in connection with your use of, or reliance upon, the content or products found herein.