
|
Meiji Holdings Co., Ltd. (2269.T) Avaliação DCF |
Totalmente Editável: Adapte-Se Às Suas Necessidades No Excel Ou Planilhas
Design Profissional: Modelos Confiáveis E Padrão Da Indústria
Pré-Construídos Para Uso Rápido E Eficiente
Compatível com MAC/PC, totalmente desbloqueado
Não É Necessária Experiência; Fácil De Seguir
Meiji Holdings Co., Ltd. (2269.T) Bundle
Procurando avaliar o valor intrínseco da Meiji Holdings Co., Ltd.? Nossa calculadora DCF (2269T) integra dados do mundo real com opções abrangentes de personalização, permitindo refinar suas previsões e fazer escolhas de investimento mais informadas.
Benefits You Will Receive
- Accurate 2269T Financial Data: Features both historical and projected figures for precise valuation.
- Customizable Inputs: Adjust metrics such as WACC, tax rates, revenue growth, and capital expenditures.
- Automated Calculations: Intrinsic value and NPV are computed in real-time.
- Scenario Planning: Explore various scenarios to assess Meiji Holdings' future performance.
- User-Friendly Design: Designed for professionals while remaining approachable for newcomers.
Key Features
- Pre-Loaded Data: Meiji Holdings' historical financial statements and pre-filled forecasts.
- Fully Adjustable Inputs: Customize WACC, tax rates, revenue growth, and EBITDA margins.
- Instant Results: View Meiji Holdings' intrinsic value recalculated in real time.
- Clear Visual Outputs: Dashboard charts present valuation results and key metrics.
- Built for Accuracy: A professional tool designed for analysts, investors, and finance professionals.
How It Works
- Download: Obtain the pre-formatted Excel file containing Meiji Holdings Co., Ltd.'s (2269T) financial data.
- Customize: Modify forecasts such as revenue growth, EBITDA %, and WACC as per your analysis.
- Update Automatically: View real-time updates for intrinsic value and NPV calculations.
- Test Scenarios: Generate various projections and instantly compare the outcomes.
- Make Decisions: Leverage the valuation results to inform your investment strategies.
Why Opt for the Meiji Holdings Calculator?
- Precision: Accurate financial insights based on real Meiji Holdings data.
- Flexibility: Tailored for users to freely experiment and adjust parameters.
- Efficiency: Eliminate the complexity of creating a DCF model from the ground up.
- Professional Quality: Crafted with the expertise and practicality expected by CFOs.
- User-Friendly: Intuitive interface suitable for users without extensive financial modeling skills.
Who Can Benefit from This Product?
- Institutional Investors: Develop comprehensive and accurate valuation models for assessing portfolios involving Meiji Holdings Co., Ltd. (2269T).
- Finance Departments: Evaluate valuation scenarios to inform corporate strategies within their organizations.
- Advisors and Consultants: Equip clients with precise valuation insights for Meiji Holdings Co., Ltd. (2269T).
- Academics and Students: Engage with real-world data to enhance learning and practice in financial modeling.
- Industry Analysts: Gain insights into how companies like Meiji Holdings Co., Ltd. (2269T) are valued in the current market landscape.
Overview of Template Contents
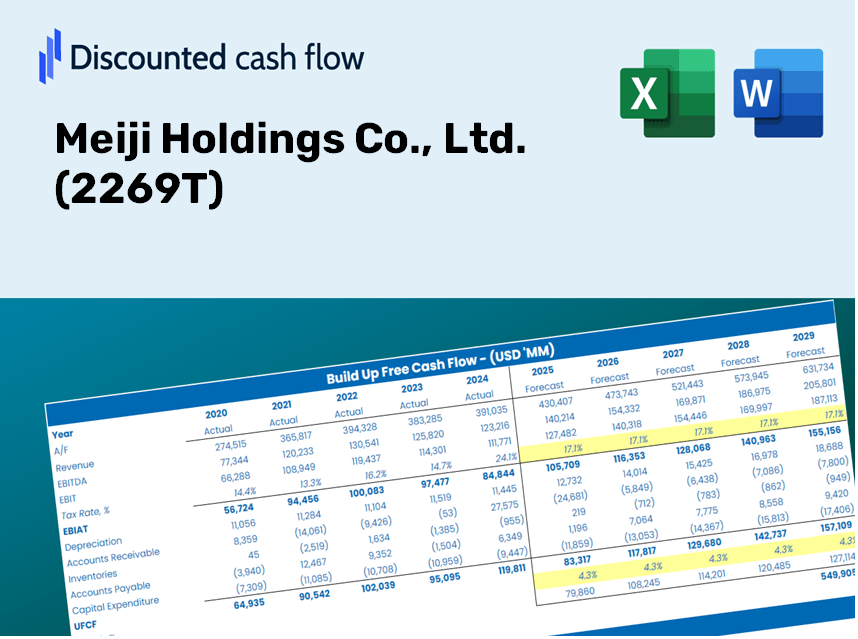
- Operating and Balance Sheet Data: Pre-filled historical data and forecasts for Meiji Holdings Co., Ltd. (2269T), including metrics such as revenue, EBITDA, EBIT, and capital expenditures.
- WACC Calculation: A dedicated worksheet for calculating the Weighted Average Cost of Capital (WACC), featuring inputs like Beta, risk-free rate, and share price.
- DCF Valuation (Unlevered and Levered): Customizable Discounted Cash Flow models that display intrinsic value along with detailed calculations.
- Financial Statements: Pre-loaded annual and quarterly financial statements to facilitate comprehensive analysis.
- Key Ratios: A comprehensive set of profitability, leverage, and efficiency ratios specific to Meiji Holdings Co., Ltd. (2269T).
- Dashboard and Charts: A visual representation of valuation outputs and assumptions, aiding in the easy analysis of results.
Disclaimer
All information, articles, and product details provided on this website are for general informational and educational purposes only. We do not claim any ownership over, nor do we intend to infringe upon, any trademarks, copyrights, logos, brand names, or other intellectual property mentioned or depicted on this site. Such intellectual property remains the property of its respective owners, and any references here are made solely for identification or informational purposes, without implying any affiliation, endorsement, or partnership.
We make no representations or warranties, express or implied, regarding the accuracy, completeness, or suitability of any content or products presented. Nothing on this website should be construed as legal, tax, investment, financial, medical, or other professional advice. In addition, no part of this site—including articles or product references—constitutes a solicitation, recommendation, endorsement, advertisement, or offer to buy or sell any securities, franchises, or other financial instruments, particularly in jurisdictions where such activity would be unlawful.
All content is of a general nature and may not address the specific circumstances of any individual or entity. It is not a substitute for professional advice or services. Any actions you take based on the information provided here are strictly at your own risk. You accept full responsibility for any decisions or outcomes arising from your use of this website and agree to release us from any liability in connection with your use of, or reliance upon, the content or products found herein.