
|
Avaliação DCF de Gushengtang Holdings Limited (2273.HK) |
Totalmente Editável: Adapte-Se Às Suas Necessidades No Excel Ou Planilhas
Design Profissional: Modelos Confiáveis E Padrão Da Indústria
Pré-Construídos Para Uso Rápido E Eficiente
Compatível com MAC/PC, totalmente desbloqueado
Não É Necessária Experiência; Fácil De Seguir
Gushengtang Holdings Limited (2273.HK) Bundle
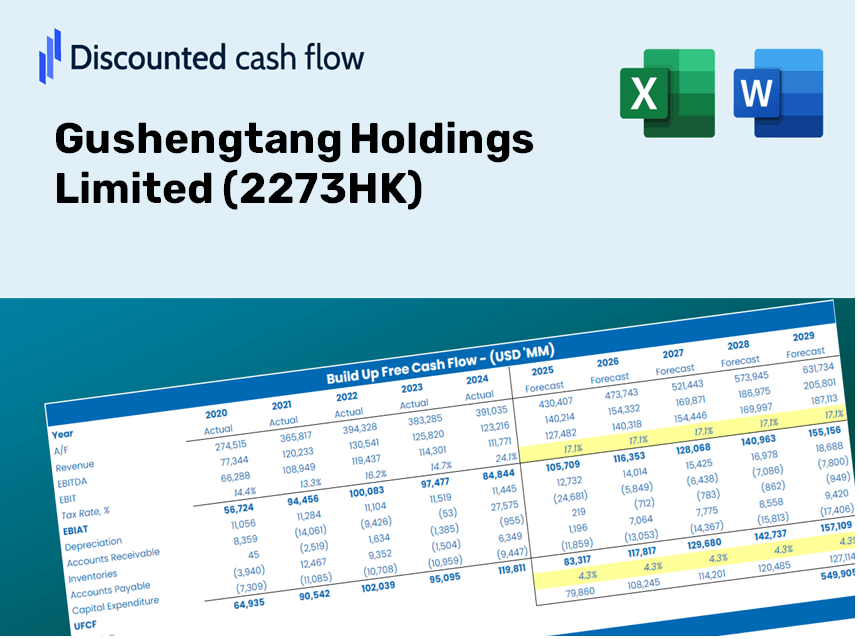
Simplifique a avaliação Gushengtang Holdings Limited (2273HK) com esta calculadora DCF personalizável! Com o Real Gushengtang Holdings Limited (2273HK) financeiras e insumos de previsão ajustáveis, você pode testar cenários e descobrir o valor justo Gushengtang Holdings Limited (2273HK) em minutos.
Discounted Cash Flow (DCF) - (USD MM)
| Year | AY1 2020 |
AY2 2021 |
AY3 2022 |
AY4 2023 |
AY5 2024 |
FY1 2025 |
FY2 2026 |
FY3 2027 |
FY4 2028 |
FY5 2029 |
|---|---|---|---|---|---|---|---|---|---|---|
| Revenue | 1,011.8 | 1,500.3 | 1,776.3 | 2,540.3 | 3,304.7 | 4,459.5 | 6,017.8 | 8,120.6 | 10,958.3 | 14,787.7 |
| Revenue Growth, % | 0 | 48.28 | 18.4 | 43.01 | 30.09 | 34.94 | 34.94 | 34.94 | 34.94 | 34.94 |
| EBITDA | 130.2 | -68.6 | 354.5 | 470.1 | 410.1 | 527.7 | 712.1 | 961.0 | 1,296.8 | 1,749.9 |
| EBITDA, % | 12.87 | -4.57 | 19.96 | 18.5 | 12.41 | 11.83 | 11.83 | 11.83 | 11.83 | 11.83 |
| Depreciation | 24.3 | 28.4 | 118.0 | 131.4 | 33.2 | 152.6 | 205.9 | 277.9 | 375.0 | 506.0 |
| Depreciation, % | 2.4 | 1.89 | 6.64 | 5.17 | 1.01 | 3.42 | 3.42 | 3.42 | 3.42 | 3.42 |
| EBIT | 106.0 | -97.0 | 236.5 | 338.7 | 376.9 | 375.1 | 506.2 | 683.1 | 921.8 | 1,243.9 |
| EBIT, % | 10.47 | -6.47 | 13.32 | 13.33 | 11.4 | 8.41 | 8.41 | 8.41 | 8.41 | 8.41 |
| Total Cash | 390.7 | 1,127.0 | 1,120.0 | 1,456.0 | 1,246.6 | 2,424.4 | 3,271.6 | 4,414.8 | 5,957.5 | 8,039.3 |
| Total Cash, percent | .0 | .0 | .0 | .0 | .0 | .0 | .0 | .0 | .0 | .0 |
| Account Receivables | 110.1 | 199.0 | 246.0 | 196.7 | 294.6 | 487.4 | 657.8 | 887.6 | 1,197.8 | 1,616.4 |
| Account Receivables, % | 10.88 | 13.26 | 13.85 | 7.74 | 8.91 | 10.93 | 10.93 | 10.93 | 10.93 | 10.93 |
| Inventories | 63.1 | 84.6 | 114.6 | 167.2 | 196.3 | 275.2 | 371.4 | 501.1 | 676.2 | 912.5 |
| Inventories, % | 6.24 | 5.64 | 6.45 | 6.58 | 5.94 | 6.17 | 6.17 | 6.17 | 6.17 | 6.17 |
| Accounts Payable | 123.7 | 176.4 | 179.7 | 313.4 | 336.4 | 504.9 | 681.3 | 919.4 | 1,240.7 | 1,674.3 |
| Accounts Payable, % | 12.22 | 11.76 | 10.11 | 12.34 | 10.18 | 11.32 | 11.32 | 11.32 | 11.32 | 11.32 |
| Capital Expenditure | -20.3 | -54.4 | -40.4 | -85.0 | -99.1 | -127.1 | -171.5 | -231.5 | -312.4 | -421.5 |
| Capital Expenditure, % | -2.01 | -3.62 | -2.28 | -3.35 | -3 | -2.85 | -2.85 | -2.85 | -2.85 | -2.85 |
| Tax Rate, % | 15.55 | 15.55 | 15.55 | 15.55 | 15.55 | 15.55 | 15.55 | 15.55 | 15.55 | 15.55 |
| EBITAT | 112.1 | -95.0 | 215.3 | 300.6 | 318.2 | 346.7 | 467.8 | 631.3 | 851.9 | 1,149.6 |
| Depreciation | ||||||||||
| Changes in Account Receivables | ||||||||||
| Changes in Inventories | ||||||||||
| Changes in Accounts Payable | ||||||||||
| Capital Expenditure | ||||||||||
| UFCF | 66.5 | -178.6 | 219.0 | 477.4 | 148.5 | 268.9 | 412.2 | 556.2 | 750.5 | 1,012.8 |
| WACC, % | 6.68 | 6.68 | 6.66 | 6.66 | 6.64 | 6.66 | 6.66 | 6.66 | 6.66 | 6.66 |
| PV UFCF | ||||||||||
| SUM PV UFCF | 2,386.0 | |||||||||
| Long Term Growth Rate, % | 3.50 | |||||||||
| Free cash flow (T + 1) | 1,048 | |||||||||
| Terminal Value | 33,125 | |||||||||
| Present Terminal Value | 23,991 | |||||||||
| Enterprise Value | 26,377 | |||||||||
| Net Debt | -665 | |||||||||
| Equity Value | 27,042 | |||||||||
| Diluted Shares Outstanding, MM | 251 | |||||||||
| Equity Value Per Share | 107.73 |
What You Will Receive
- Customizable Excel Template: An entirely adaptable Excel-based DCF Calculator complete with pre-filled financials for Gushengtang Holdings Limited (2273HK).
- Accurate Market Data: Access to historical figures and forward-looking projections (highlighted in the yellow cells).
- Flexible Forecasting: Modify key assumptions such as revenue growth, EBITDA margin, and WACC as per your analysis.
- Instant Calculations: See the immediate effects of your inputs on Gushengtang Holdings' (2273HK) valuation.
- Professional-Grade Tool: Designed specifically for investors, CFOs, consultants, and financial analysts.
- Intuitive Design: Organized for ease of understanding and use, complete with step-by-step guidance.
Key Features
- Customizable Forecast Inputs: Easily adjust essential parameters such as revenue growth, EBITDA %, and capital investment.
- Instant DCF Valuation: Automatically generates intrinsic value, NPV, and additional financial metrics in real-time.
- High-Precision Accuracy: Leverages Gushengtang Holdings Limited’s (2273HK) actual financial data for reliable valuation results.
- Simplified Scenario Analysis: Effortlessly explore varying assumptions and evaluate outcomes side by side.
- Efficiency Booster: Remove the hassle of constructing intricate valuation models from the ground up.
How It Functions
- Step 1: Download the ready-to-use Excel template featuring Gushengtang Holdings Limited’s [2273HK] data.
- Step 2: Review the pre-populated sheets to familiarize yourself with the essential metrics.
- Step 3: Modify forecasts and assumptions within the editable yellow cells (WACC, growth, margins).
- Step 4: Instantly observe the recalibrated results, including the intrinsic value of Gushengtang Holdings Limited [2273HK].
- Step 5: Make well-informed investment choices or create reports based on the generated outputs.
Why Opt for This Calculator?
- All-in-One Solution: Combines DCF, WACC, and financial ratio analyses for thorough evaluations.
- Flexible Inputs: Modify the highlighted cells to explore different financial scenarios.
- In-Depth Analysis: Automatically computes Gushengtang Holdings Limited's intrinsic value and Net Present Value.
- Built-In Data: Includes both historical and projected data for reliable starting points.
- Expert-Level Tool: Perfect for financial analysts, investors, and business advisors working with Gushengtang (2273HK).
Who Can Benefit from This Product?
- Investors: Evaluate Gushengtang's valuation before making stock transactions.
- CFOs and Financial Analysts: Optimize valuation workflows and assess financial forecasts.
- Startup Founders: Gain insights into how established companies like Gushengtang are valued.
- Consultants: Provide comprehensive valuation reports for your clients.
- Students and Educators: Utilize real-world examples to learn and teach valuation methodologies.
What the Template Contains
- Historical Data: Comprehensive records of Gushengtang Holdings Limited’s past financial performance and foundational forecasts.
- DCF and Levered DCF Models: In-depth templates for assessing the intrinsic value of Gushengtang Holdings Limited.
- WACC Sheet: Built-in calculations for the Weighted Average Cost of Capital.
- Editable Inputs: Customize key factors such as growth rates, EBITDA %, and CAPEX assumptions.
- Quarterly and Annual Statements: Detailed breakdown of Gushengtang Holdings Limited's financial statements.
- Interactive Dashboard: Dynamically visualize valuation outcomes and projections.
Disclaimer
All information, articles, and product details provided on this website are for general informational and educational purposes only. We do not claim any ownership over, nor do we intend to infringe upon, any trademarks, copyrights, logos, brand names, or other intellectual property mentioned or depicted on this site. Such intellectual property remains the property of its respective owners, and any references here are made solely for identification or informational purposes, without implying any affiliation, endorsement, or partnership.
We make no representations or warranties, express or implied, regarding the accuracy, completeness, or suitability of any content or products presented. Nothing on this website should be construed as legal, tax, investment, financial, medical, or other professional advice. In addition, no part of this site—including articles or product references—constitutes a solicitation, recommendation, endorsement, advertisement, or offer to buy or sell any securities, franchises, or other financial instruments, particularly in jurisdictions where such activity would be unlawful.
All content is of a general nature and may not address the specific circumstances of any individual or entity. It is not a substitute for professional advice or services. Any actions you take based on the information provided here are strictly at your own risk. You accept full responsibility for any decisions or outcomes arising from your use of this website and agree to release us from any liability in connection with your use of, or reliance upon, the content or products found herein.