
|
Shanghai Conant Optical Co., Ltd. (2276.HK) Avaliação DCF |
Totalmente Editável: Adapte-Se Às Suas Necessidades No Excel Ou Planilhas
Design Profissional: Modelos Confiáveis E Padrão Da Indústria
Pré-Construídos Para Uso Rápido E Eficiente
Compatível com MAC/PC, totalmente desbloqueado
Não É Necessária Experiência; Fácil De Seguir
Shanghai Conant Optical Co., Ltd. (2276.HK) Bundle
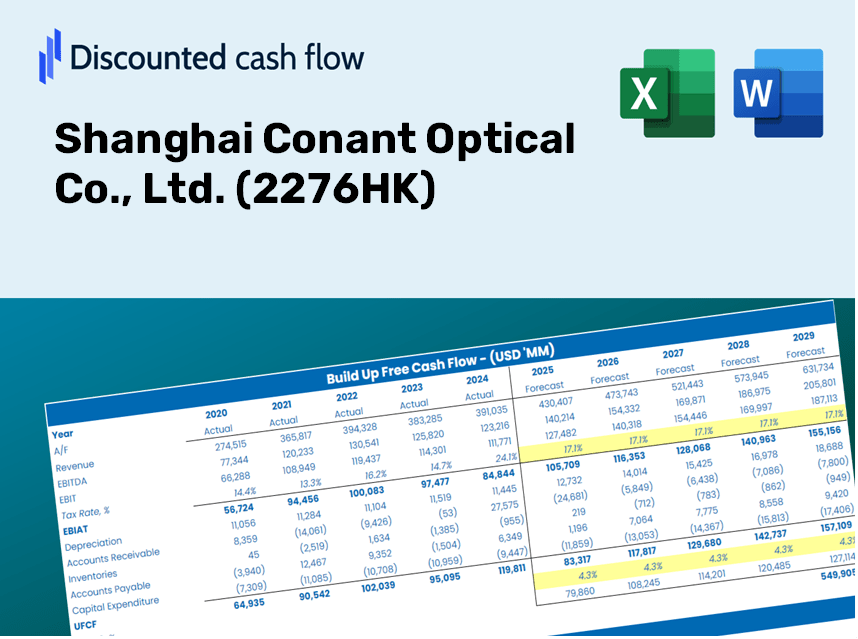
Seja você um investidor ou analista, esta calculadora DCF (2276HK) é sua ferramenta preferida para uma avaliação precisa. Pré -carregado com dados reais da Shanghai Conant Optical Co., Ltd., você pode ajustar as previsões e observar instantaneamente os efeitos.
Discounted Cash Flow (DCF) - (USD MM)
| Year | AY1 2020 |
AY2 2021 |
AY3 2022 |
AY4 2023 |
AY5 2024 |
FY1 2025 |
FY2 2026 |
FY3 2027 |
FY4 2028 |
FY5 2029 |
|---|---|---|---|---|---|---|---|---|---|---|
| Revenue | 1,194.3 | 1,481.6 | 1,705.8 | 1,922.5 | 2,251.5 | 2,639.8 | 3,095.2 | 3,629.2 | 4,255.2 | 4,989.2 |
| Revenue Growth, % | 0 | 24.05 | 15.13 | 12.7 | 17.11 | 17.25 | 17.25 | 17.25 | 17.25 | 17.25 |
| EBITDA | 271.0 | 324.4 | 387.8 | 508.9 | 635.9 | 644.3 | 755.4 | 885.7 | 1,038.5 | 1,217.7 |
| EBITDA, % | 22.69 | 21.89 | 22.74 | 26.47 | 28.24 | 24.41 | 24.41 | 24.41 | 24.41 | 24.41 |
| Depreciation | 49.9 | 51.2 | 52.1 | 64.6 | 81.3 | 93.2 | 109.3 | 128.2 | 150.3 | 176.2 |
| Depreciation, % | 4.18 | 3.45 | 3.05 | 3.36 | 3.61 | 3.53 | 3.53 | 3.53 | 3.53 | 3.53 |
| EBIT | 221.1 | 273.2 | 335.7 | 444.3 | 554.6 | 551.1 | 646.1 | 757.6 | 888.2 | 1,041.5 |
| EBIT, % | 18.51 | 18.44 | 19.68 | 23.11 | 24.63 | 20.87 | 20.87 | 20.87 | 20.87 | 20.87 |
| Total Cash | 220.5 | 803.4 | 494.0 | 602.6 | 708.5 | 868.3 | 1,018.1 | 1,193.7 | 1,399.6 | 1,641.1 |
| Total Cash, percent | .0 | .0 | .0 | .0 | .0 | .0 | .0 | .0 | .0 | .0 |
| Account Receivables | 252.5 | 232.4 | 274.5 | 318.7 | 392.0 | 458.9 | 538.0 | 630.8 | 739.7 | 867.3 |
| Account Receivables, % | 21.14 | 15.68 | 16.1 | 16.58 | 17.41 | 17.38 | 17.38 | 17.38 | 17.38 | 17.38 |
| Inventories | 427.6 | 446.8 | 582.6 | 531.5 | 614.9 | 818.7 | 960.0 | 1,125.5 | 1,319.7 | 1,547.4 |
| Inventories, % | 35.8 | 30.15 | 34.15 | 27.65 | 27.31 | 31.01 | 31.01 | 31.01 | 31.01 | 31.01 |
| Accounts Payable | 92.1 | 86.3 | 102.8 | 137.8 | 206.8 | 189.6 | 222.4 | 260.7 | 305.7 | 358.4 |
| Accounts Payable, % | 7.71 | 5.82 | 6.03 | 7.17 | 9.19 | 7.18 | 7.18 | 7.18 | 7.18 | 7.18 |
| Capital Expenditure | -55.6 | -41.3 | -130.6 | -144.4 | -246.0 | -177.1 | -207.6 | -243.4 | -285.4 | -334.7 |
| Capital Expenditure, % | -4.66 | -2.78 | -7.66 | -7.51 | -10.93 | -6.71 | -6.71 | -6.71 | -6.71 | -6.71 |
| Tax Rate, % | 13.89 | 13.89 | 13.89 | 13.89 | 13.89 | 13.89 | 13.89 | 13.89 | 13.89 | 13.89 |
| EBITAT | 182.9 | 233.1 | 296.4 | 369.7 | 477.5 | 469.1 | 550.1 | 644.9 | 756.2 | 886.6 |
| Depreciation | ||||||||||
| Changes in Account Receivables | ||||||||||
| Changes in Inventories | ||||||||||
| Changes in Accounts Payable | ||||||||||
| Capital Expenditure | ||||||||||
| UFCF | -410.8 | 238.1 | 56.5 | 331.8 | 225.1 | 97.5 | 264.1 | 309.6 | 363.1 | 425.7 |
| WACC, % | 4.63 | 4.63 | 4.63 | 4.63 | 4.63 | 4.63 | 4.63 | 4.63 | 4.63 | 4.63 |
| PV UFCF | ||||||||||
| SUM PV UFCF | 1,247.3 | |||||||||
| Long Term Growth Rate, % | 2.00 | |||||||||
| Free cash flow (T + 1) | 434 | |||||||||
| Terminal Value | 16,529 | |||||||||
| Present Terminal Value | 13,184 | |||||||||
| Enterprise Value | 14,431 | |||||||||
| Net Debt | -198 | |||||||||
| Equity Value | 14,629 | |||||||||
| Diluted Shares Outstanding, MM | 417 | |||||||||
| Equity Value Per Share | 35.10 |
What You Will Receive
- Customizable Excel Template: A fully adaptable Excel-based DCF Calculator featuring pre-loaded financial data for Shanghai Conant Optical Co., Ltd. (2276HK).
- Authentic Data: Access to historical performance metrics and future projections, highlighted in the designated yellow cells.
- Adjustable Forecasting: Modify key forecast variables such as revenue growth, EBITDA percentage, and weighted average cost of capital (WACC).
- Instant Calculations: Quickly observe how your changes affect the valuation of Shanghai Conant Optical Co., Ltd. (2276HK).
- Professional Resource: Designed specifically for investors, CFOs, consultants, and financial analysts.
- Intuitive Layout: Created for simplicity and user-friendliness, complete with detailed instructions.
Key Features
- Authentic Financial Insights: Gain access to precise historical data and future forecasts tailored for Shanghai Conant Optical Co., Ltd. (2276HK).
- Adjustable Forecast Variables: Modify the yellow-highlighted fields, including WACC, growth rates, and profit margins.
- Real-Time Calculations: Enjoy automatic updates to DCF, Net Present Value (NPV), and cash flow assessments.
- Interactive Dashboard: View clear charts and summaries to easily interpret your valuation findings.
- Designed for All Levels: An intuitive layout suited for investors, CFOs, and consultants, whether seasoned or new to the field.
How It Operates
- Download: Obtain the ready-to-use Excel file featuring Shanghai Conant Optical Co., Ltd.'s (2276HK) financial data.
- Customize: Tailor forecasts including revenue growth, EBITDA percentage, and WACC to your needs.
- Update Automatically: Watch as the intrinsic value and NPV calculations refresh in real-time.
- Test Scenarios: Develop various projections and compare the results instantaneously.
- Make Decisions: Leverage the valuation findings to inform your investment approach.
Why Choose This Calculator for Shanghai Conant Optical Co., Ltd. (2276HK)?
- All-in-One Tool: Combines DCF, WACC, and various financial ratio analyses into a single solution.
- Flexible Inputs: Modify the yellow-highlighted fields to explore different scenarios.
- In-Depth Analysis: Automatically computes the intrinsic value and Net Present Value for Shanghai Conant Optical Co., Ltd. (2276HK).
- Data-Driven: Features historical and projected data for reliable baseline assessments.
- High-Quality Standards: Perfect for financial analysts, investors, and business advisors.
Who Can Benefit from This Product?
- Optical Industry Professionals: Develop comprehensive and accurate valuation models for market analysis.
- Corporate Finance Departments: Examine valuation scenarios to inform strategic decisions.
- Consultants and Advisors: Deliver precise valuation insights for Shanghai Conant Optical Co., Ltd. (2276HK).
- Students and Instructors: Utilize real-world data to enhance financial modeling skills and education.
- Technology Enthusiasts: Gain insights into how optical companies like Shanghai Conant Optical are assessed in the market.
Contents of the Template
- Pre-Filled DCF Model: Shanghai Conant Optical Co., Ltd.'s (2276HK) financial data preloaded for immediate use.
- WACC Calculator: Comprehensive calculations for Weighted Average Cost of Capital.
- Financial Ratios: Analyze Shanghai Conant's (2276HK) profitability, leverage, and efficiency.
- Editable Inputs: Modify assumptions such as growth rates, margins, and CAPEX to tailor your scenarios.
- Financial Statements: Annual and quarterly reports provided to facilitate in-depth analysis.
- Interactive Dashboard: Easily visualize essential valuation metrics and outcomes.
Disclaimer
All information, articles, and product details provided on this website are for general informational and educational purposes only. We do not claim any ownership over, nor do we intend to infringe upon, any trademarks, copyrights, logos, brand names, or other intellectual property mentioned or depicted on this site. Such intellectual property remains the property of its respective owners, and any references here are made solely for identification or informational purposes, without implying any affiliation, endorsement, or partnership.
We make no representations or warranties, express or implied, regarding the accuracy, completeness, or suitability of any content or products presented. Nothing on this website should be construed as legal, tax, investment, financial, medical, or other professional advice. In addition, no part of this site—including articles or product references—constitutes a solicitation, recommendation, endorsement, advertisement, or offer to buy or sell any securities, franchises, or other financial instruments, particularly in jurisdictions where such activity would be unlawful.
All content is of a general nature and may not address the specific circumstances of any individual or entity. It is not a substitute for professional advice or services. Any actions you take based on the information provided here are strictly at your own risk. You accept full responsibility for any decisions or outcomes arising from your use of this website and agree to release us from any liability in connection with your use of, or reliance upon, the content or products found herein.