
|
NH Foods Ltd. (2282.T) Avaliação DCF |
Totalmente Editável: Adapte-Se Às Suas Necessidades No Excel Ou Planilhas
Design Profissional: Modelos Confiáveis E Padrão Da Indústria
Pré-Construídos Para Uso Rápido E Eficiente
Compatível com MAC/PC, totalmente desbloqueado
Não É Necessária Experiência; Fácil De Seguir
NH Foods Ltd. (2282.T) Bundle
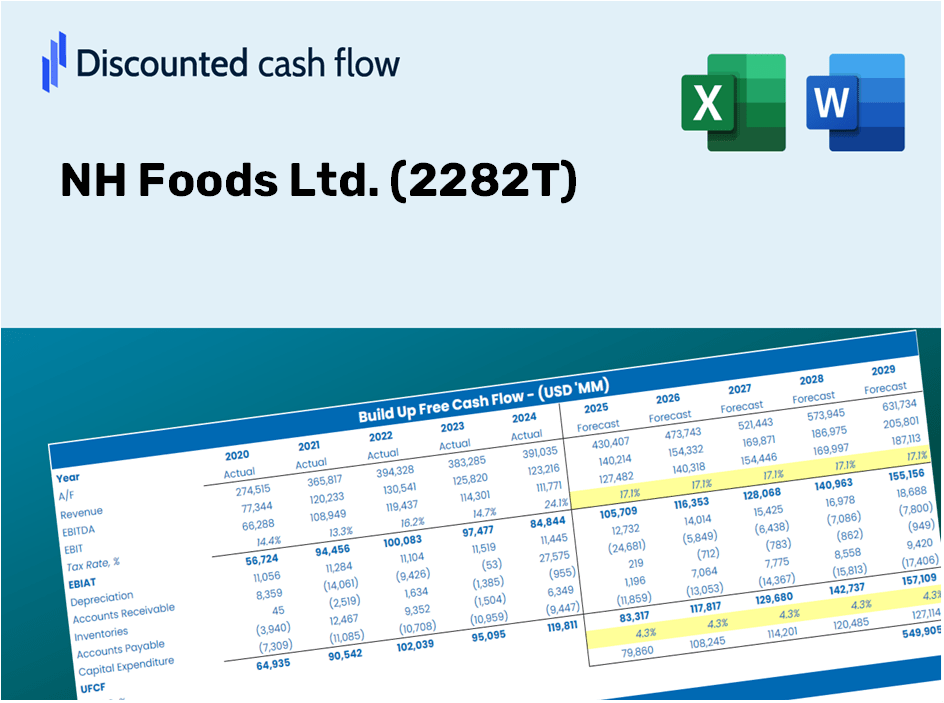
Projetado para precisão, nossa calculadora DCF (2282T) permite avaliar a avaliação da NH Foods Ltd. Usando dados financeiros reais, fornecendo flexibilidade completa para modificar todos os parâmetros essenciais para projeções aprimoradas.
What You Will Receive
- Authentic NH Foods Financials: Access to both historical and projected data for precise valuation.
- Customizable Inputs: Adjust WACC, tax rates, revenue growth, and capital expenditures as needed.
- Automated Calculations: Intrinsic value and NPV are computed in real-time.
- Scenario Analysis: Explore various scenarios to assess NH Foods' future performance.
- User-Friendly Design: Crafted for professionals while remaining approachable for newcomers.
Key Features
- 🔍 Real-Life NH Foods Financials: Pre-filled historical and projected data for NH Foods Ltd. (2282T).
- ✏️ Fully Customizable Inputs: Adjust all critical parameters (yellow cells) such as WACC, growth %, and tax rates.
- 📊 Professional DCF Valuation: Integrated formulas that calculate NH Foods’ intrinsic value using the Discounted Cash Flow method.
- ⚡ Instant Results: Visualize NH Foods’ valuation immediately after making modifications.
- Scenario Analysis: Evaluate and compare outcomes for different financial assumptions side-by-side.
How It Works
- Step 1: Download the Excel file.
- Step 2: Review NH Foods Ltd.'s pre-filled financial data and forecasts.
- Step 3: Adjust key inputs such as revenue growth, WACC, and tax rates (highlighted cells).
- Step 4: Observe the DCF model refresh instantly as you modify the assumptions.
- Step 5: Evaluate the outputs and apply the findings to your investment strategies.
Why Opt for This Calculator?
- User-Friendly and Accessible: Perfect for both newcomers and seasoned professionals.
- Customizable Inputs: Easily adjust parameters to suit your analysis needs.
- Real-Time Adjustments: Witness immediate updates to NH Foods Ltd. (2282T) valuation as you change inputs.
- Preloaded Data: Comes equipped with NH Foods Ltd.'s actual financial figures for swift assessments.
- Relied Upon by Experts: Trusted by investors and analysts for informed decision-making.
Who Can Benefit from NH Foods Ltd. (2282T)?
- Finance Students: Master valuation methods and apply them to real-world data.
- Researchers: Integrate industry-standard models into your academic projects or studies.
- Investors: Evaluate your hypotheses and assess valuation results for NH Foods Ltd. (2282T).
- Financial Analysts: Enhance your analysis process with a ready-to-use, customizable DCF model.
- Entrepreneurs: Discover how major public firms like NH Foods Ltd. (2282T) are evaluated in the market.
Overview of Template Contents
- Preloaded NH Foods Data: Historical and projected financial figures, including revenue, EBIT, and capital expenditures.
- DCF and WACC Models: Professional-grade spreadsheets designed for calculating intrinsic value and Weighted Average Cost of Capital.
- Editable Inputs: Yellow-highlighted cells for modifying revenue growth, tax rates, and discount rates.
- Financial Statements: Detailed annual and quarterly financial data for thorough analysis.
- Key Ratios: Metrics for profitability, leverage, and efficiency to assess performance.
- Dashboard and Charts: Visual representations of valuation results and underlying assumptions.
Disclaimer
All information, articles, and product details provided on this website are for general informational and educational purposes only. We do not claim any ownership over, nor do we intend to infringe upon, any trademarks, copyrights, logos, brand names, or other intellectual property mentioned or depicted on this site. Such intellectual property remains the property of its respective owners, and any references here are made solely for identification or informational purposes, without implying any affiliation, endorsement, or partnership.
We make no representations or warranties, express or implied, regarding the accuracy, completeness, or suitability of any content or products presented. Nothing on this website should be construed as legal, tax, investment, financial, medical, or other professional advice. In addition, no part of this site—including articles or product references—constitutes a solicitation, recommendation, endorsement, advertisement, or offer to buy or sell any securities, franchises, or other financial instruments, particularly in jurisdictions where such activity would be unlawful.
All content is of a general nature and may not address the specific circumstances of any individual or entity. It is not a substitute for professional advice or services. Any actions you take based on the information provided here are strictly at your own risk. You accept full responsibility for any decisions or outcomes arising from your use of this website and agree to release us from any liability in connection with your use of, or reliance upon, the content or products found herein.