
|
Chervon Holdings Limited (2285.HK) Avaliação DCF |
Totalmente Editável: Adapte-Se Às Suas Necessidades No Excel Ou Planilhas
Design Profissional: Modelos Confiáveis E Padrão Da Indústria
Pré-Construídos Para Uso Rápido E Eficiente
Compatível com MAC/PC, totalmente desbloqueado
Não É Necessária Experiência; Fácil De Seguir
Chervon Holdings Limited (2285.HK) Bundle
Simplifique sua análise e melhore a precisão com a nossa calculadora DCF (2285HK)! Utilizando dados limitados de Chervon Holdings em tempo real e suposições personalizáveis, essa ferramenta o capacita a prever, analisar e valorizar (2285HK) como um investidor experiente.
Discounted Cash Flow (DCF) - (USD MM)
| Year | AY1 2020 |
AY2 2021 |
AY3 2022 |
AY4 2023 |
AY5 2024 |
FY1 2025 |
FY2 2026 |
FY3 2027 |
FY4 2028 |
FY5 2029 |
|---|---|---|---|---|---|---|---|---|---|---|
| Revenue | 9,328.8 | 13,654.8 | 15,466.6 | 10,679.5 | 13,784.4 | 15,775.0 | 18,053.0 | 20,660.0 | 23,643.6 | 27,057.9 |
| Revenue Growth, % | 0 | 46.37 | 13.27 | -30.95 | 29.07 | 14.44 | 14.44 | 14.44 | 14.44 | 14.44 |
| EBITDA | 776.9 | 1,433.3 | 1,899.7 | -20.0 | 1,552.0 | 1,330.7 | 1,522.9 | 1,742.8 | 1,994.5 | 2,282.5 |
| EBITDA, % | 8.33 | 10.5 | 12.28 | -0.18688 | 11.26 | 8.44 | 8.44 | 8.44 | 8.44 | 8.44 |
| Depreciation | 142.6 | 182.9 | 201.0 | 221.9 | 434.9 | 296.6 | 339.4 | 388.4 | 444.5 | 508.7 |
| Depreciation, % | 1.53 | 1.34 | 1.3 | 2.08 | 3.16 | 1.88 | 1.88 | 1.88 | 1.88 | 1.88 |
| EBIT | 634.3 | 1,250.4 | 1,698.7 | -241.9 | 1,117.1 | 1,034.1 | 1,183.5 | 1,354.4 | 1,550.0 | 1,773.8 |
| EBIT, % | 6.8 | 9.16 | 10.98 | -2.26 | 8.1 | 6.56 | 6.56 | 6.56 | 6.56 | 6.56 |
| Total Cash | 1,339.1 | 5,463.3 | 3,782.5 | 2,302.9 | 2,554.8 | 3,751.9 | 4,293.7 | 4,913.7 | 5,623.3 | 6,435.4 |
| Total Cash, percent | .0 | .0 | .0 | .0 | .0 | .0 | .0 | .0 | .0 | .0 |
| Account Receivables | 2,134.0 | 2,318.8 | 1,711.4 | 2,790.0 | 3,803.8 | 3,301.4 | 3,778.2 | 4,323.8 | 4,948.2 | 5,662.8 |
| Account Receivables, % | 22.88 | 16.98 | 11.06 | 26.12 | 27.6 | 20.93 | 20.93 | 20.93 | 20.93 | 20.93 |
| Inventories | 2,268.2 | 4,643.1 | 5,143.8 | 4,126.1 | 4,727.3 | 5,190.1 | 5,939.6 | 6,797.4 | 7,779.0 | 8,902.3 |
| Inventories, % | 24.31 | 34 | 33.26 | 38.64 | 34.29 | 32.9 | 32.9 | 32.9 | 32.9 | 32.9 |
| Accounts Payable | 1,923.6 | 2,328.2 | 2,288.2 | 1,748.2 | 2,470.8 | 2,737.3 | 3,132.5 | 3,584.9 | 4,102.6 | 4,695.1 |
| Accounts Payable, % | 20.62 | 17.05 | 14.79 | 16.37 | 17.92 | 17.35 | 17.35 | 17.35 | 17.35 | 17.35 |
| Capital Expenditure | -245.1 | -630.4 | -561.2 | -686.3 | -573.0 | -676.9 | -774.7 | -886.6 | -1,014.6 | -1,161.1 |
| Capital Expenditure, % | -2.63 | -4.62 | -3.63 | -6.43 | -4.16 | -4.29 | -4.29 | -4.29 | -4.29 | -4.29 |
| Tax Rate, % | 15.28 | 15.28 | 15.28 | 15.28 | 15.28 | 15.28 | 15.28 | 15.28 | 15.28 | 15.28 |
| EBITAT | 472.8 | 1,026.3 | 1,466.9 | -183.8 | 946.4 | 835.0 | 955.6 | 1,093.6 | 1,251.5 | 1,432.2 |
| Depreciation | ||||||||||
| Changes in Account Receivables | ||||||||||
| Changes in Inventories | ||||||||||
| Changes in Accounts Payable | ||||||||||
| Capital Expenditure | ||||||||||
| UFCF | -2,108.4 | -1,576.2 | 1,173.3 | -1,249.2 | -84.1 | 760.6 | -310.7 | -355.6 | -406.9 | -465.7 |
| WACC, % | 9.65 | 9.7 | 9.73 | 9.66 | 9.72 | 9.69 | 9.69 | 9.69 | 9.69 | 9.69 |
| PV UFCF | ||||||||||
| SUM PV UFCF | -408.5 | |||||||||
| Long Term Growth Rate, % | 3.00 | |||||||||
| Free cash flow (T + 1) | -480 | |||||||||
| Terminal Value | -7,166 | |||||||||
| Present Terminal Value | -4,512 | |||||||||
| Enterprise Value | -4,921 | |||||||||
| Net Debt | -150 | |||||||||
| Equity Value | -4,771 | |||||||||
| Diluted Shares Outstanding, MM | 510 | |||||||||
| Equity Value Per Share | -9.35 |
What You Will Receive
- Customizable Excel Template: A fully adaptable Excel-based DCF Calculator featuring pre-filled financial data for Chervon Holdings Limited (2285HK).
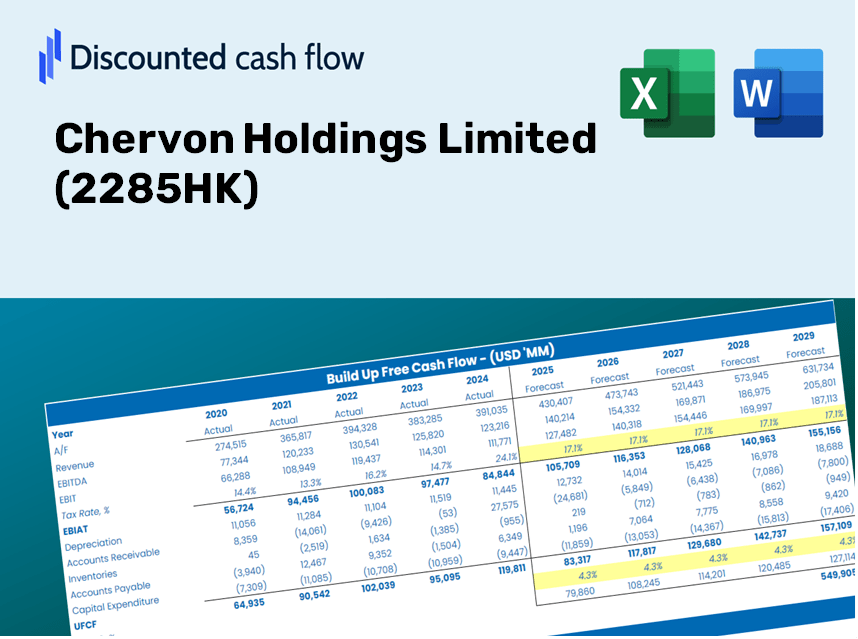
- Accurate Market Data: Access to historical data and forward-looking projections (highlighted in the yellow cells).
- Flexible Forecasting: Adjust forecast parameters such as revenue growth, EBITDA margin, and WACC.
- Instant Calculations: Quickly observe how your inputs affect the valuation of Chervon Holdings Limited (2285HK).
- Professional Resource: Designed for investors, CFOs, consultants, and financial analysts.
- User-Friendly Interface: Organized for clarity and simplicity, complete with step-by-step guidance.
Key Features
- 🔍 Real-Life CHV Financials: Pre-filled historical and projected data for Chervon Holdings Limited (2285HK).
- ✏️ Fully Customizable Inputs: Adjust all critical parameters (yellow cells) such as WACC, growth %, and tax rates.
- 📊 Professional DCF Valuation: Built-in formulas compute Chervon’s intrinsic value using the Discounted Cash Flow method.
- ⚡ Instant Results: Visualize Chervon’s valuation immediately after making adjustments.
- Scenario Analysis: Evaluate and compare outcomes for different financial assumptions side-by-side.
How It Operates
- Step 1: Download the ready-to-use Excel template featuring Chervon Holdings Limited’s data.
- Step 2: Review the pre-filled sheets to familiarize yourself with the key performance indicators.
- Step 3: Modify the forecasts and assumptions in the editable yellow cells (WACC, growth, margins).
- Step 4: Instantly access the updated results, including the intrinsic value of Chervon Holdings Limited (2285HK).
- Step 5: Utilize the outputs to make informed investment choices or create detailed reports.
Why Opt for This Calculator?
- Precision: Reliable Chervon financials guarantee data integrity.
- Versatility: Built for users to easily experiment with and alter inputs.
- Efficiency: Avoid the complexities of constructing a DCF model from the ground up.
- High-Quality: Crafted with the accuracy and functionality expected by CFOs.
- User-Friendly: Intuitive design makes it accessible for users without extensive financial modeling skills.
Who Can Benefit from This Product?
- Individual Investors: Gain insights to make informed decisions regarding the buying or selling of Chervon Holdings Limited (2285HK) shares.
- Financial Analysts: Enhance your valuation processes with easy-to-use financial models tailored for Chervon Holdings Limited (2285HK).
- Consultants: Provide clients with accurate and timely valuation insights related to Chervon Holdings Limited (2285HK).
- Business Owners: Learn how major companies like Chervon Holdings Limited (2285HK) are assessed to inform your own business strategies.
- Finance Students: Master valuation techniques using real-life data from Chervon Holdings Limited (2285HK) and related scenarios.
What the Template Includes
- Preloaded 2285HK Data: Historical and projected financial metrics, encompassing revenue, EBIT, and capital expenditures.
- DCF and WACC Models: High-quality spreadsheets designed for calculating intrinsic value and Weighted Average Cost of Capital.
- Editable Inputs: Cells highlighted in yellow for modifying revenue growth rates, tax levels, and discount rates.
- Financial Statements: Detailed annual and quarterly financial reports for in-depth analysis.
- Key Ratios: Profitability, leverage, and efficiency ratios for performance assessment.
- Dashboard and Charts: Visual representations of valuation results and underlying assumptions.
Disclaimer
All information, articles, and product details provided on this website are for general informational and educational purposes only. We do not claim any ownership over, nor do we intend to infringe upon, any trademarks, copyrights, logos, brand names, or other intellectual property mentioned or depicted on this site. Such intellectual property remains the property of its respective owners, and any references here are made solely for identification or informational purposes, without implying any affiliation, endorsement, or partnership.
We make no representations or warranties, express or implied, regarding the accuracy, completeness, or suitability of any content or products presented. Nothing on this website should be construed as legal, tax, investment, financial, medical, or other professional advice. In addition, no part of this site—including articles or product references—constitutes a solicitation, recommendation, endorsement, advertisement, or offer to buy or sell any securities, franchises, or other financial instruments, particularly in jurisdictions where such activity would be unlawful.
All content is of a general nature and may not address the specific circumstances of any individual or entity. It is not a substitute for professional advice or services. Any actions you take based on the information provided here are strictly at your own risk. You accept full responsibility for any decisions or outcomes arising from your use of this website and agree to release us from any liability in connection with your use of, or reliance upon, the content or products found herein.