
|
Lepu Scientech Medical Technology Co., Ltd. (2291.HK) Avaliação DCF |
Totalmente Editável: Adapte-Se Às Suas Necessidades No Excel Ou Planilhas
Design Profissional: Modelos Confiáveis E Padrão Da Indústria
Pré-Construídos Para Uso Rápido E Eficiente
Compatível com MAC/PC, totalmente desbloqueado
Não É Necessária Experiência; Fácil De Seguir
LEPU ScienTech Medical Technology (Shanghai) Co., Ltd. (2291.HK) Bundle
Projetado para precisão, nossa calculadora DCF (2291HK) o capacita a avaliar a avaliação da Lepu Scientech Medical Technology (Shanghai) Co., Ltd. Usando dados financeiros em tempo real e completa flexibilidade para modificar parâmetros essenciais para projeções aprimoradas.
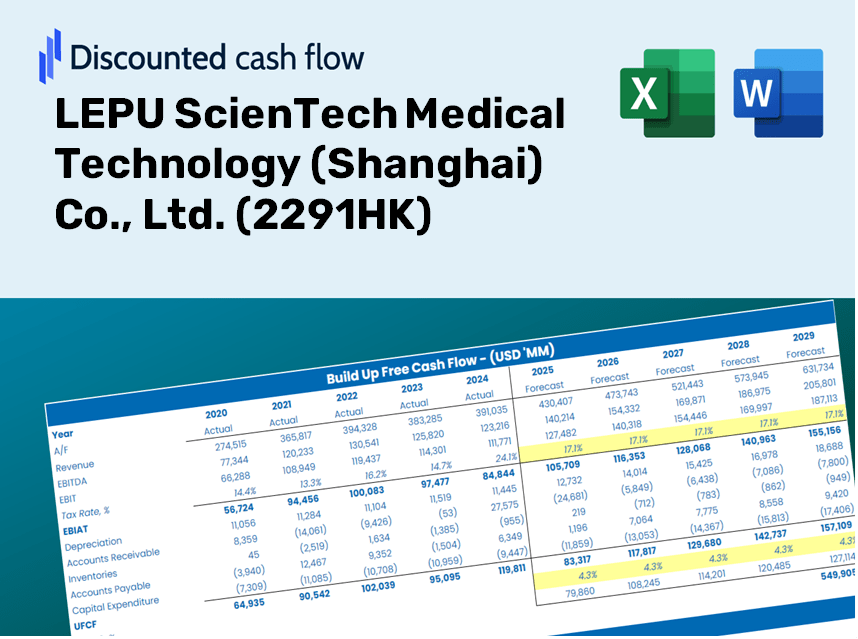
Discounted Cash Flow (DCF) - (USD MM)
| Year | AY1 2020 |
AY2 2021 |
AY3 2022 |
AY4 2023 |
AY5 2024 |
FY1 2025 |
FY2 2026 |
FY3 2027 |
FY4 2028 |
FY5 2029 |
|---|---|---|---|---|---|---|---|---|---|---|
| Revenue | 162.1 | 243.4 | 270.8 | 356.3 | 515.7 | 693.2 | 931.9 | 1,252.8 | 1,684.2 | 2,264.0 |
| Revenue Growth, % | 0 | 50.14 | 11.27 | 31.58 | 44.72 | 34.43 | 34.43 | 34.43 | 34.43 | 34.43 |
| EBITDA | 90.5 | 95.5 | 20.6 | 206.9 | 315.0 | 307.6 | 413.5 | 555.9 | 747.2 | 1,004.5 |
| EBITDA, % | 55.85 | 39.26 | 7.59 | 58.06 | 61.08 | 44.37 | 44.37 | 44.37 | 44.37 | 44.37 |
| Depreciation | 6.7 | 10.7 | 16.3 | 17.2 | 2.0 | 27.4 | 36.8 | 49.5 | 66.5 | 89.4 |
| Depreciation, % | 4.12 | 4.41 | 6 | 4.82 | 0.39118 | 3.95 | 3.95 | 3.95 | 3.95 | 3.95 |
| EBIT | 83.8 | 84.8 | 4.3 | 189.7 | 313.0 | 280.2 | 376.7 | 506.4 | 680.7 | 915.1 |
| EBIT, % | 51.73 | 34.85 | 1.59 | 53.24 | 60.69 | 40.42 | 40.42 | 40.42 | 40.42 | 40.42 |
| Total Cash | 21.3 | 780.1 | 1,314.9 | 1,385.0 | 1,230.5 | 572.8 | 770.0 | 1,035.1 | 1,391.6 | 1,870.7 |
| Total Cash, percent | .0 | .0 | .0 | .0 | .0 | .0 | .0 | .0 | .0 | .0 |
| Account Receivables | 41.9 | 26.1 | 33.5 | 37.2 | 79.0 | 103.6 | 139.2 | 187.1 | 251.6 | 338.2 |
| Account Receivables, % | 25.85 | 10.72 | 12.36 | 10.44 | 15.32 | 14.94 | 14.94 | 14.94 | 14.94 | 14.94 |
| Inventories | 25.5 | 36.5 | 62.8 | 101.4 | 95.4 | 139.9 | 188.0 | 252.8 | 339.8 | 456.8 |
| Inventories, % | 15.73 | 15.01 | 23.18 | 28.47 | 18.5 | 20.18 | 20.18 | 20.18 | 20.18 | 20.18 |
| Accounts Payable | 4.8 | 7.3 | 13.4 | 20.6 | 34.3 | 32.4 | 43.6 | 58.6 | 78.8 | 105.9 |
| Accounts Payable, % | 2.98 | 3 | 4.95 | 5.79 | 6.66 | 4.68 | 4.68 | 4.68 | 4.68 | 4.68 |
| Capital Expenditure | -17.1 | -100.4 | -91.1 | -106.6 | -93.4 | -185.1 | -248.9 | -334.5 | -449.7 | -604.6 |
| Capital Expenditure, % | -10.57 | -41.26 | -33.66 | -29.92 | -18.11 | -26.7 | -26.7 | -26.7 | -26.7 | -26.7 |
| Tax Rate, % | 14.17 | 14.17 | 14.17 | 14.17 | 14.17 | 14.17 | 14.17 | 14.17 | 14.17 | 14.17 |
| EBITAT | 75.2 | 75.4 | 5.7 | 165.9 | 268.6 | 253.2 | 340.4 | 457.6 | 615.2 | 827.0 |
| Depreciation | ||||||||||
| Changes in Account Receivables | ||||||||||
| Changes in Inventories | ||||||||||
| Changes in Accounts Payable | ||||||||||
| Capital Expenditure | ||||||||||
| UFCF | 2.2 | -7.0 | -96.7 | 41.2 | 155.2 | 24.5 | 55.7 | 74.9 | 100.7 | 135.3 |
| WACC, % | 4.66 | 4.66 | 4.66 | 4.66 | 4.66 | 4.66 | 4.66 | 4.66 | 4.66 | 4.66 |
| PV UFCF | ||||||||||
| SUM PV UFCF | 331.3 | |||||||||
| Long Term Growth Rate, % | 2.00 | |||||||||
| Free cash flow (T + 1) | 138 | |||||||||
| Terminal Value | 5,199 | |||||||||
| Present Terminal Value | 4,141 | |||||||||
| Enterprise Value | 4,472 | |||||||||
| Net Debt | -1,229 | |||||||||
| Equity Value | 5,701 | |||||||||
| Diluted Shares Outstanding, MM | 347 | |||||||||
| Equity Value Per Share | 16.44 |
What You Will Receive
- Customizable Excel Template: A fully editable Excel-based DCF Calculator featuring pre-filled financial data for LEPU ScienTech Medical Technology (Shanghai) Co., Ltd. (2291HK).
- Accurate Data: Historical performance data and forward-looking projections (highlighted in the yellow cells).
- Flexible Forecasting: Adjust your forecast assumptions such as revenue growth, EBITDA margin, and WACC as needed.
- Instant Calculations: Quickly assess how your inputs affect the valuation of LEPU ScienTech Medical Technology (Shanghai) Co., Ltd. (2291HK).
- High-Quality Tool: Designed for investors, CFOs, consultants, and financial analysts.
- Intuitive Interface: Organized for easy navigation and usability, complete with detailed instructions.
Key Features
- Customizable Projections: Adjust essential inputs such as sales growth, EBITDA margin, and capital expenditures.
- Instant DCF Valuation: Quickly calculates intrinsic value, NPV, and additional outputs.
- High-Precision Results: Incorporates LEPU ScienTech's real-world financial data for accurate valuation insights.
- Streamlined Scenario Analysis: Effortlessly explore various assumptions and evaluate outcomes.
- Efficiency Booster: Avoid the hassle of creating intricate valuation models from the ground up.
How It Functions
- Step 1: Download the Excel template.
- Step 2: Examine the pre-filled LEPU ScienTech data (historical and forecasted).
- Step 3: Modify the key assumptions (highlighted in yellow) based on your findings.
- Step 4: Observe the automatic updates for LEPU ScienTech's intrinsic value.
- Step 5: Utilize the results for investment strategies or reporting purposes.
Why Choose LEPU ScienTech Medical Technology (Shanghai) Co., Ltd. (2291HK)?
- Save Time: Eliminate the hassle of building models from scratch – our tools are ready for immediate use.
- Enhance Accuracy: Dependable medical data and formulas minimize errors in analysis and assessment.
- Fully Customizable: Adjust the model to align with your specific expectations and forecasts.
- Easy to Understand: Intuitive charts and outputs facilitate straightforward result interpretation.
- Preferred by Professionals: Crafted for experts who prioritize both accuracy and user-friendliness.
Who Can Benefit from This Product?
- Healthcare Investors: Develop comprehensive and trustworthy valuation models for analyzing portfolios in the medical technology sector.
- Corporate Finance Departments: Evaluate valuation scenarios to inform strategic decisions within their organizations.
- Consultants and Advisors: Deliver precise valuation insights regarding LEPU ScienTech Medical Technology (2291HK) to clients.
- Students and Educators: Utilize real-world data for practicing and teaching financial modeling techniques.
- Medical Technology Enthusiasts: Gain a deeper understanding of how companies like LEPU ScienTech are valued within the market.
Contents of the Template
- Operating and Balance Sheet Data: Pre-filled historical data and forecasts for LEPU ScienTech Medical Technology (Shanghai) Co., Ltd. (2291HK), covering metrics such as revenue, EBITDA, EBIT, and capital expenditures.
- WACC Calculation: A dedicated sheet for calculating the Weighted Average Cost of Capital (WACC), featuring inputs like Beta, risk-free rate, and share price.
- DCF Valuation (Unlevered and Levered): Customizable Discounted Cash Flow models that provide an analysis of intrinsic value with comprehensive calculations.
- Financial Statements: Pre-loaded annual and quarterly financial statements to facilitate thorough analysis.
- Key Ratios: Essential profitability, leverage, and efficiency ratios specifically for LEPU ScienTech Medical Technology (Shanghai) Co., Ltd. (2291HK).
- Dashboard and Charts: A visual representation of valuation outputs and key assumptions for easy result analysis.
Disclaimer
All information, articles, and product details provided on this website are for general informational and educational purposes only. We do not claim any ownership over, nor do we intend to infringe upon, any trademarks, copyrights, logos, brand names, or other intellectual property mentioned or depicted on this site. Such intellectual property remains the property of its respective owners, and any references here are made solely for identification or informational purposes, without implying any affiliation, endorsement, or partnership.
We make no representations or warranties, express or implied, regarding the accuracy, completeness, or suitability of any content or products presented. Nothing on this website should be construed as legal, tax, investment, financial, medical, or other professional advice. In addition, no part of this site—including articles or product references—constitutes a solicitation, recommendation, endorsement, advertisement, or offer to buy or sell any securities, franchises, or other financial instruments, particularly in jurisdictions where such activity would be unlawful.
All content is of a general nature and may not address the specific circumstances of any individual or entity. It is not a substitute for professional advice or services. Any actions you take based on the information provided here are strictly at your own risk. You accept full responsibility for any decisions or outcomes arising from your use of this website and agree to release us from any liability in connection with your use of, or reliance upon, the content or products found herein.