
|
Systena Corporation (2317.T) Avaliação DCF |
Totalmente Editável: Adapte-Se Às Suas Necessidades No Excel Ou Planilhas
Design Profissional: Modelos Confiáveis E Padrão Da Indústria
Pré-Construídos Para Uso Rápido E Eficiente
Compatível com MAC/PC, totalmente desbloqueado
Não É Necessária Experiência; Fácil De Seguir
Systena Corporation (2317.T) Bundle
Aprimore sua estratégia de investimento com a calculadora DCF da Systena Corporation (2317T)! Utilize dados financeiros precisos, ajuste as projeções e despesas de crescimento e observe instantaneamente como essas modificações afetam o valor intrínseco da Systena Corporation.
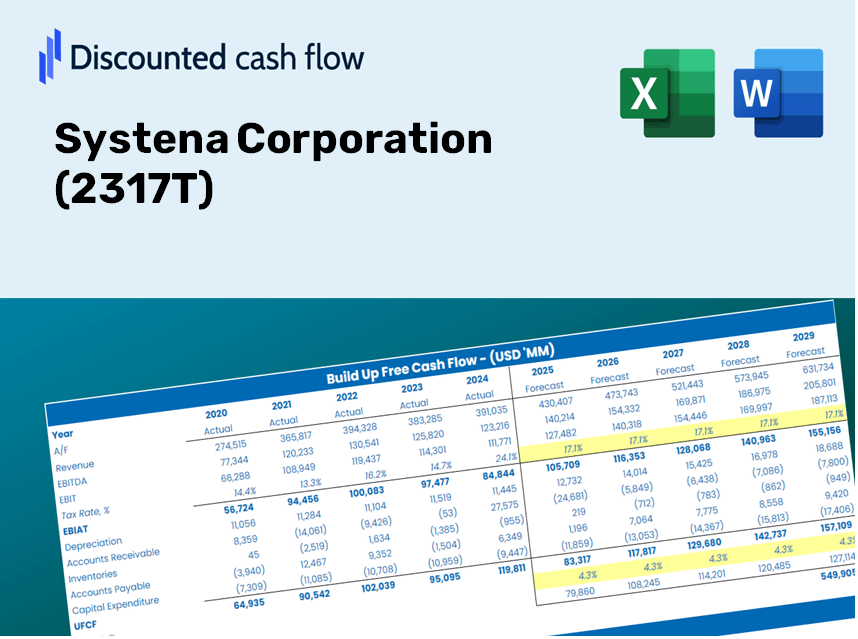
Discounted Cash Flow (DCF) - (USD MM)
| Year | AY1 2020 |
AY2 2021 |
AY3 2022 |
AY4 2023 |
AY5 2024 |
FY1 2025 |
FY2 2026 |
FY3 2027 |
FY4 2028 |
FY5 2029 |
|---|---|---|---|---|---|---|---|---|---|---|
| Revenue | 60,871.0 | 65,272.0 | 74,526.0 | 76,940.0 | 83,621.0 | 90,588.8 | 98,137.1 | 106,314.4 | 115,173.1 | 124,770.0 |
| Revenue Growth, % | 0 | 7.23 | 14.18 | 3.24 | 8.68 | 8.33 | 8.33 | 8.33 | 8.33 | 8.33 |
| EBITDA | 8,291.0 | 9,087.0 | 10,440.0 | 10,525.0 | 12,319.0 | 12,675.6 | 13,731.8 | 14,876.0 | 16,115.6 | 17,458.4 |
| EBITDA, % | 13.62 | 13.92 | 14.01 | 13.68 | 14.73 | 13.99 | 13.99 | 13.99 | 13.99 | 13.99 |
| Depreciation | 356.0 | 429.0 | 478.0 | 576.0 | 460.0 | 576.5 | 624.6 | 676.6 | 733.0 | 794.1 |
| Depreciation, % | 0.58484 | 0.65725 | 0.64139 | 0.74864 | 0.5501 | 0.63644 | 0.63644 | 0.63644 | 0.63644 | 0.63644 |
| EBIT | 7,935.0 | 8,658.0 | 9,962.0 | 9,949.0 | 11,859.0 | 12,099.1 | 13,107.2 | 14,199.4 | 15,382.5 | 16,664.3 |
| EBIT, % | 13.04 | 13.26 | 13.37 | 12.93 | 14.18 | 13.36 | 13.36 | 13.36 | 13.36 | 13.36 |
| Total Cash | 19,037.0 | 21,657.0 | 25,033.0 | 30,895.0 | 22,827.0 | 29,984.2 | 32,482.7 | 35,189.3 | 38,121.5 | 41,298.0 |
| Total Cash, percent | .0 | .0 | .0 | .0 | .0 | .0 | .0 | .0 | .0 | .0 |
| Account Receivables | 12,825.0 | 14,322.0 | 14,397.0 | 14,916.0 | 18,604.0 | 18,835.9 | 20,405.4 | 22,105.7 | 23,947.7 | 25,943.1 |
| Account Receivables, % | 21.07 | 21.94 | 19.32 | 19.39 | 22.25 | 20.79 | 20.79 | 20.79 | 20.79 | 20.79 |
| Inventories | 834.0 | 1,151.0 | 1,501.0 | 1,220.0 | 2,053.0 | 1,664.7 | 1,803.4 | 1,953.7 | 2,116.5 | 2,292.9 |
| Inventories, % | 1.37 | 1.76 | 2.01 | 1.59 | 2.46 | 1.84 | 1.84 | 1.84 | 1.84 | 1.84 |
| Accounts Payable | 5,257.0 | 5,696.0 | 6,096.0 | 6,438.0 | 9,063.0 | 8,107.4 | 8,782.9 | 9,514.8 | 10,307.6 | 11,166.5 |
| Accounts Payable, % | 8.64 | 8.73 | 8.18 | 8.37 | 10.84 | 8.95 | 8.95 | 8.95 | 8.95 | 8.95 |
| Capital Expenditure | -442.0 | -519.0 | -1,158.0 | -341.0 | -318.0 | -706.3 | -765.2 | -828.9 | -898.0 | -972.8 |
| Capital Expenditure, % | -0.72613 | -0.79513 | -1.55 | -0.4432 | -0.38029 | -0.77971 | -0.77971 | -0.77971 | -0.77971 | -0.77971 |
| Tax Rate, % | 28.42 | 28.42 | 28.42 | 28.42 | 28.42 | 28.42 | 28.42 | 28.42 | 28.42 | 28.42 |
| EBITAT | 5,257.6 | 6,047.9 | 7,322.1 | 7,237.1 | 8,488.3 | 8,564.5 | 9,278.1 | 10,051.2 | 10,888.7 | 11,796.0 |
| Depreciation | ||||||||||
| Changes in Account Receivables | ||||||||||
| Changes in Inventories | ||||||||||
| Changes in Accounts Payable | ||||||||||
| Capital Expenditure | ||||||||||
| UFCF | -3,230.4 | 4,582.9 | 6,617.1 | 7,576.1 | 6,734.3 | 7,635.4 | 8,104.8 | 8,780.2 | 9,511.8 | 10,304.3 |
| WACC, % | 8.16 | 8.16 | 8.17 | 8.17 | 8.17 | 8.17 | 8.17 | 8.17 | 8.17 | 8.17 |
| PV UFCF | ||||||||||
| SUM PV UFCF | 34,833.0 | |||||||||
| Long Term Growth Rate, % | 0.50 | |||||||||
| Free cash flow (T + 1) | 10,356 | |||||||||
| Terminal Value | 135,104 | |||||||||
| Present Terminal Value | 91,250 | |||||||||
| Enterprise Value | 126,083 | |||||||||
| Net Debt | -19,914 | |||||||||
| Equity Value | 145,997 | |||||||||
| Diluted Shares Outstanding, MM | 366 | |||||||||
| Equity Value Per Share | 398.84 |
What You'll Receive
- Genuine Systena Financials: Offers both historical and projected data for precise valuation.
- Customizable Inputs: Adjust WACC, tax rates, revenue growth, and capital expenditure as needed.
- Real-Time Calculations: Intrinsic value and NPV are computed dynamically.
- Scenario Analysis: Explore various scenarios to assess Systena's future performance.
- User-Friendly Design: Tailored for professionals while remaining accessible for novices.
Key Features
- Pre-Loaded Data: Systena Corporation’s historical financial statements and pre-filled forecasts.
- Fully Adjustable Inputs: Modify WACC, tax rates, revenue growth, and EBITDA margins as needed.
- Instant Results: View Systena Corporation’s intrinsic value recalculating in real time.
- Clear Visual Outputs: Dashboard charts present valuation results and essential metrics.
- Built for Accuracy: A professional-grade tool designed for analysts, investors, and finance professionals.
How It Functions
- Download the Template: Gain immediate access to the Excel-based Systena Corporation (2317T) DCF Calculator.
- Input Your Assumptions: Modify the yellow-highlighted cells for growth rates, WACC, margins, and additional factors.
- Instant Calculations: The model automatically recalculates Systena Corporation's intrinsic value.
- Test Scenarios: Experiment with various assumptions to see how they affect the valuation.
- Analyze and Decide: Utilize the findings to inform your investment or financial decisions.
Why Opt for the Systena Corporation Calculator?
- Precision: Utilizes authentic Systena Corporation (2317T) financial data for reliable results.
- Versatility: Crafted to allow users to easily test and adjust their inputs.
- Efficiency: Eliminate the tedious process of constructing a DCF model from the ground up.
- Enterprise-Level: Designed with the expertise and functionality expected at the CFO level.
- Intuitive: Simple to navigate, even for those without extensive experience in financial modeling.
Who Can Benefit from This Product?
- Investors: Accurately assess Systena Corporation’s (2317T) fair value prior to making investment choices.
- CFOs: Utilize a high-quality DCF model for comprehensive financial reporting and analysis.
- Consultants: Effortlessly customize the template for valuation reports tailored to clients’ needs.
- Entrepreneurs: Acquire insights into the financial modeling techniques employed by leading companies.
- Educators: Implement it as a pedagogical resource to illustrate various valuation methodologies.
What the Template Contains
- Pre-Filled DCF Model: Systena Corporation’s financial data preloaded for immediate use.
- WACC Calculator: Detailed calculations for Weighted Average Cost of Capital tailored for Systena Corporation.
- Financial Ratios: Assess Systena Corporation’s profitability, leverage, and efficiency metrics.
- Editable Inputs: Modify assumptions such as growth rates, margins, and CAPEX to align with your scenarios.
- Financial Statements: Comprehensive annual and quarterly reports to aid in thorough analysis.
- Interactive Dashboard: Effortlessly visualize key valuation metrics and outcomes for Systena Corporation.
Disclaimer
All information, articles, and product details provided on this website are for general informational and educational purposes only. We do not claim any ownership over, nor do we intend to infringe upon, any trademarks, copyrights, logos, brand names, or other intellectual property mentioned or depicted on this site. Such intellectual property remains the property of its respective owners, and any references here are made solely for identification or informational purposes, without implying any affiliation, endorsement, or partnership.
We make no representations or warranties, express or implied, regarding the accuracy, completeness, or suitability of any content or products presented. Nothing on this website should be construed as legal, tax, investment, financial, medical, or other professional advice. In addition, no part of this site—including articles or product references—constitutes a solicitation, recommendation, endorsement, advertisement, or offer to buy or sell any securities, franchises, or other financial instruments, particularly in jurisdictions where such activity would be unlawful.
All content is of a general nature and may not address the specific circumstances of any individual or entity. It is not a substitute for professional advice or services. Any actions you take based on the information provided here are strictly at your own risk. You accept full responsibility for any decisions or outcomes arising from your use of this website and agree to release us from any liability in connection with your use of, or reliance upon, the content or products found herein.