
|
NS Solutions Corporation (2327.T) Avaliação DCF |
Totalmente Editável: Adapte-Se Às Suas Necessidades No Excel Ou Planilhas
Design Profissional: Modelos Confiáveis E Padrão Da Indústria
Pré-Construídos Para Uso Rápido E Eficiente
Compatível com MAC/PC, totalmente desbloqueado
Não É Necessária Experiência; Fácil De Seguir
NS Solutions Corporation (2327.T) Bundle
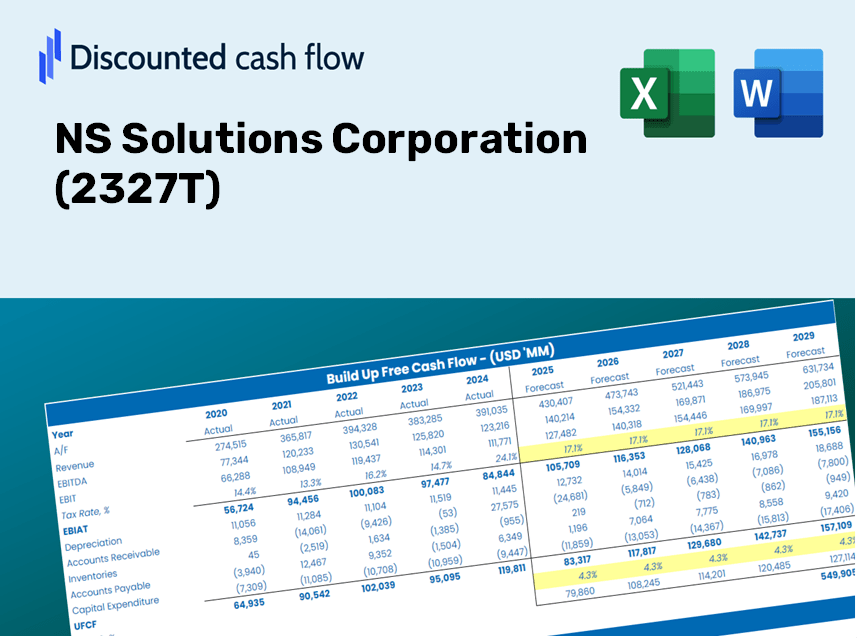
Simplifique a avaliação da NS Solutions Corporation (2327T) com esta calculadora DCF personalizável! Apresentando o NS Solutions Corporation (2327T) e os insumos de previsão ajustáveis, você pode testar cenários e descobrir o valor justo da NS Solutions Corporation (2327T) em minutos.
Discounted Cash Flow (DCF) - (USD MM)
| Year | AY1 2021 |
AY2 2022 |
AY3 2023 |
AY4 2024 |
AY5 2025 |
FY1 2026 |
FY2 2027 |
FY3 2028 |
FY4 2029 |
FY5 2030 |
|---|---|---|---|---|---|---|---|---|---|---|
| Revenue | 251,992.0 | 270,332.0 | 291,688.0 | 310,632.0 | 338,301.0 | 364,164.0 | 392,004.2 | 421,972.8 | 454,232.5 | 488,958.4 |
| Revenue Growth, % | 0 | 7.28 | 7.9 | 6.49 | 8.91 | 7.64 | 7.64 | 7.64 | 7.64 | 7.64 |
| EBITDA | 31,935.0 | 41,902.0 | 44,940.0 | 47,681.0 | 51,676.0 | 54,045.5 | 58,177.3 | 62,624.9 | 67,412.6 | 72,566.2 |
| EBITDA, % | 12.67 | 15.5 | 15.41 | 15.35 | 15.28 | 14.84 | 14.84 | 14.84 | 14.84 | 14.84 |
| Depreciation | 6,610.0 | 11,637.0 | 12,620.0 | 12,050.0 | 12,134.0 | 13,634.5 | 14,676.9 | 15,798.9 | 17,006.7 | 18,306.9 |
| Depreciation, % | 2.62 | 4.3 | 4.33 | 3.88 | 3.59 | 3.74 | 3.74 | 3.74 | 3.74 | 3.74 |
| EBIT | 25,325.0 | 30,265.0 | 32,320.0 | 35,631.0 | 39,542.0 | 40,411.0 | 43,500.4 | 46,826.0 | 50,405.8 | 54,259.4 |
| EBIT, % | 10.05 | 11.2 | 11.08 | 11.47 | 11.69 | 11.1 | 11.1 | 11.1 | 11.1 | 11.1 |
| Total Cash | 6,255.0 | 7,865.0 | 101,322.0 | 103,975.0 | 192,931.0 | 95,141.1 | 102,414.6 | 110,244.2 | 118,672.3 | 127,744.8 |
| Total Cash, percent | .0 | .0 | .0 | .0 | .0 | .0 | .0 | .0 | .0 | .0 |
| Account Receivables | 61,049.0 | 55,246.0 | 79,881.0 | 85,929.0 | 92,929.0 | 92,629.2 | 99,710.7 | 107,333.5 | 115,539.2 | 124,372.1 |
| Account Receivables, % | 24.23 | 20.44 | 27.39 | 27.66 | 27.47 | 25.44 | 25.44 | 25.44 | 25.44 | 25.44 |
| Inventories | 28,386.0 | 19,647.0 | 21,526.0 | 25,176.0 | 32,083.0 | 31,682.6 | 34,104.8 | 36,712.1 | 39,518.7 | 42,539.9 |
| Inventories, % | 11.26 | 7.27 | 7.38 | 8.1 | 9.48 | 8.7 | 8.7 | 8.7 | 8.7 | 8.7 |
| Accounts Payable | 15,884.0 | 17,828.0 | 24,656.0 | 23,263.0 | 30,690.0 | 27,612.2 | 29,723.2 | 31,995.5 | 34,441.6 | 37,074.6 |
| Accounts Payable, % | 6.3 | 6.59 | 8.45 | 7.49 | 9.07 | 7.58 | 7.58 | 7.58 | 7.58 | 7.58 |
| Capital Expenditure | -3,644.0 | -5,337.0 | -4,400.0 | -3,122.0 | -3,513.0 | -5,078.1 | -5,466.3 | -5,884.2 | -6,334.0 | -6,818.3 |
| Capital Expenditure, % | -1.45 | -1.97 | -1.51 | -1.01 | -1.04 | -1.39 | -1.39 | -1.39 | -1.39 | -1.39 |
| Tax Rate, % | 30.81 | 30.81 | 30.81 | 30.81 | 30.81 | 30.81 | 30.81 | 30.81 | 30.81 | 30.81 |
| EBITAT | 16,986.7 | 20,238.8 | 22,150.1 | 24,373.7 | 27,357.9 | 27,485.4 | 29,586.7 | 31,848.6 | 34,283.4 | 36,904.3 |
| Depreciation | ||||||||||
| Changes in Account Receivables | ||||||||||
| Changes in Inventories | ||||||||||
| Changes in Accounts Payable | ||||||||||
| Capital Expenditure | ||||||||||
| UFCF | -53,598.3 | 43,024.8 | 10,684.1 | 22,210.7 | 29,498.9 | 33,664.2 | 31,404.6 | 33,805.4 | 36,389.8 | 39,171.8 |
| WACC, % | 6.01 | 6.01 | 6.02 | 6.02 | 6.02 | 6.02 | 6.02 | 6.02 | 6.02 | 6.02 |
| PV UFCF | ||||||||||
| SUM PV UFCF | 146,121.6 | |||||||||
| Long Term Growth Rate, % | 2.00 | |||||||||
| Free cash flow (T + 1) | 39,955 | |||||||||
| Terminal Value | 994,853 | |||||||||
| Present Terminal Value | 742,844 | |||||||||
| Enterprise Value | 888,966 | |||||||||
| Net Debt | -163,712 | |||||||||
| Equity Value | 1,052,678 | |||||||||
| Diluted Shares Outstanding, MM | 183 | |||||||||
| Equity Value Per Share | 5,753.22 |
What You Will Gain
- Customizable Excel Template: A fully adjustable Excel-based DCF Calculator featuring pre-loaded financial data for NS Solutions Corporation (2327T).
- Accurate Data Insights: Access to historical performance and future projections (highlighted in the yellow cells).
- Forecast Customization: Tailor assumptions regarding revenue growth, EBITDA percentages, and WACC as needed.
- Instant Calculations: Quickly assess how your inputs affect the valuation of NS Solutions Corporation (2327T).
- Professional-Grade Tool: Designed for investors, CFOs, consultants, and financial analysts.
- User-Friendly Interface: Organized for straightforward navigation and ease of use, complete with step-by-step guidance.
Key Features
- Real-Time NS Solutions Data: Pre-loaded with NS Solutions Corporation’s historical financial data and future projections.
- Customizable Inputs: Tailor revenue growth, profit margins, WACC, tax rates, and capital expenditures to your preferences.
- Dynamic Valuation Model: Automatically refreshes Net Present Value (NPV) and intrinsic value based on your provided inputs.
- Scenario Analysis: Generate various forecast scenarios to evaluate multiple valuation results.
- User-Centric Interface: Intuitive and organized, catering to both industry professionals and novices.
How It Functions
- Download the Template: Gain immediate access to the Excel-based NS Solutions Corporation (2327T) DCF Calculator.
- Input Your Parameters: Modify the yellow-highlighted cells for growth rates, WACC, margins, and additional factors.
- Instant Calculations: The model automatically recalculates NS Solutions Corporation’s intrinsic value.
- Explore Scenarios: Test various assumptions to assess potential changes in valuation.
- Analyze and Decide: Utilize the outcomes to inform your investment or financial analysis.
Why Opt for NS Solutions Corporation's Calculator?
- Time-Efficient: Skip the hassle of building a DCF model from the ground up – it’s ready for immediate use.
- Enhanced Precision: Access to dependable financial data and formulas minimizes valuation errors.
- Completely Customizable: Adjust the model to suit your unique assumptions and forecasts.
- User-Friendly: Intuitive charts and outputs facilitate straightforward result analysis.
- Endorsed by Professionals: Crafted for experts who prioritize accuracy and functionality.
Who Can Benefit from Our Product?
- Professional Investors: Develop comprehensive and trustworthy valuation models for in-depth portfolio assessment.
- Corporate Finance Teams: Evaluate valuation scenarios to inform strategic decisions within the company.
- Consultants and Advisors: Equip clients with precise valuation insights for NS Solutions Corporation (2327T).
- Students and Educators: Utilize real-world data for hands-on practice and instruction in financial modeling.
- Tech Enthusiasts: Gain insights into the market valuation of technology companies like NS Solutions Corporation (2327T).
Contents of the Template
- Pre-Populated Data: Features NS Solutions Corporation's historical financial information and projections.
- Discounted Cash Flow Model: Editable DCF valuation model with automatic calculations for convenience.
- Weighted Average Cost of Capital (WACC): A dedicated section for computing WACC using customized inputs.
- Essential Financial Ratios: Assess NS Solutions Corporation's profitability, efficiency, and leverage metrics.
- Customizable Parameters: Easily modify revenue growth rates, margins, and tax percentages.
- User-Friendly Dashboard: Visual representations and tables that summarize key valuation outcomes.
Disclaimer
All information, articles, and product details provided on this website are for general informational and educational purposes only. We do not claim any ownership over, nor do we intend to infringe upon, any trademarks, copyrights, logos, brand names, or other intellectual property mentioned or depicted on this site. Such intellectual property remains the property of its respective owners, and any references here are made solely for identification or informational purposes, without implying any affiliation, endorsement, or partnership.
We make no representations or warranties, express or implied, regarding the accuracy, completeness, or suitability of any content or products presented. Nothing on this website should be construed as legal, tax, investment, financial, medical, or other professional advice. In addition, no part of this site—including articles or product references—constitutes a solicitation, recommendation, endorsement, advertisement, or offer to buy or sell any securities, franchises, or other financial instruments, particularly in jurisdictions where such activity would be unlawful.
All content is of a general nature and may not address the specific circumstances of any individual or entity. It is not a substitute for professional advice or services. Any actions you take based on the information provided here are strictly at your own risk. You accept full responsibility for any decisions or outcomes arising from your use of this website and agree to release us from any liability in connection with your use of, or reliance upon, the content or products found herein.