
|
Li Ning Company Limited (2331.HK) Avaliação DCF |
Totalmente Editável: Adapte-Se Às Suas Necessidades No Excel Ou Planilhas
Design Profissional: Modelos Confiáveis E Padrão Da Indústria
Pré-Construídos Para Uso Rápido E Eficiente
Compatível com MAC/PC, totalmente desbloqueado
Não É Necessária Experiência; Fácil De Seguir
Li Ning Company Limited (2331.HK) Bundle
Avalie o potencial financeiro da Li Ning Company Limited como um especialista! Esta calculadora DCF (2331HK) vem com dados financeiros pré-preenchidos e oferece total flexibilidade para modificar o crescimento da receita, WACC, margens e outras suposições essenciais para se alinhar às suas projeções.
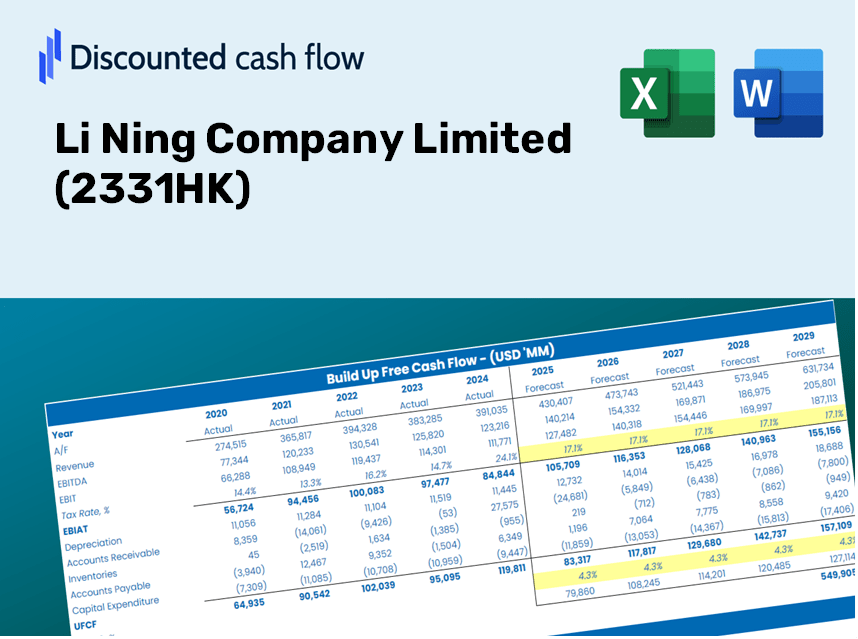
Discounted Cash Flow (DCF) - (USD MM)
| Year | AY1 2020 |
AY2 2021 |
AY3 2022 |
AY4 2023 |
AY5 2024 |
FY1 2025 |
FY2 2026 |
FY3 2027 |
FY4 2028 |
FY5 2029 |
|---|---|---|---|---|---|---|---|---|---|---|
| Revenue | 15,808.6 | 24,682.6 | 28,215.8 | 30,178.8 | 31,356.6 | 32,624.8 | 33,944.3 | 35,317.2 | 36,745.6 | 38,231.7 |
| Revenue Growth, % | 0 | 56.13 | 14.31 | 6.96 | 3.9 | 4.04 | 4.04 | 4.04 | 4.04 | 4.04 |
| EBITDA | 3,624.6 | 7,144.0 | 7,623.1 | 6,903.6 | 6,694.7 | 8,033.1 | 8,358.0 | 8,696.1 | 9,047.8 | 9,413.7 |
| EBITDA, % | 22.93 | 28.94 | 27.02 | 22.88 | 21.35 | 24.62 | 24.62 | 24.62 | 24.62 | 24.62 |
| Depreciation | 1,107.5 | 1,247.1 | 1,589.7 | 2,074.0 | 2,031.2 | 2,025.5 | 2,107.4 | 2,192.7 | 2,281.3 | 2,373.6 |
| Depreciation, % | 7.01 | 5.05 | 5.63 | 6.87 | 6.48 | 6.21 | 6.21 | 6.21 | 6.21 | 6.21 |
| EBIT | 2,517.0 | 5,896.9 | 6,033.4 | 4,829.6 | 4,663.5 | 6,007.6 | 6,250.6 | 6,503.4 | 6,766.4 | 7,040.1 |
| EBIT, % | 15.92 | 23.89 | 21.38 | 16 | 14.87 | 18.41 | 18.41 | 18.41 | 18.41 | 18.41 |
| Total Cash | 7,859.0 | 16,561.8 | 8,775.9 | 9,773.2 | 17,236.7 | 15,351.2 | 15,972.1 | 16,618.1 | 17,290.2 | 17,989.5 |
| Total Cash, percent | .0 | .0 | .0 | .0 | .0 | .0 | .0 | .0 | .0 | .0 |
| Account Receivables | 791.7 | 1,073.4 | 1,212.4 | 1,512.5 | 1,366.9 | 1,502.4 | 1,563.1 | 1,626.3 | 1,692.1 | 1,760.5 |
| Account Receivables, % | 5.01 | 4.35 | 4.3 | 5.01 | 4.36 | 4.6 | 4.6 | 4.6 | 4.6 | 4.6 |
| Inventories | 1,471.3 | 1,938.5 | 2,655.0 | 2,726.3 | 2,841.1 | 2,914.4 | 3,032.3 | 3,154.9 | 3,282.5 | 3,415.3 |
| Inventories, % | 9.31 | 7.85 | 9.41 | 9.03 | 9.06 | 8.93 | 8.93 | 8.93 | 8.93 | 8.93 |
| Accounts Payable | 1,341.9 | 1,748.8 | 1,732.6 | 1,957.1 | 1,777.1 | 2,209.8 | 2,299.1 | 2,392.1 | 2,488.9 | 2,589.5 |
| Accounts Payable, % | 8.49 | 7.09 | 6.14 | 6.49 | 5.67 | 6.77 | 6.77 | 6.77 | 6.77 | 6.77 |
| Capital Expenditure | -815.3 | -1,123.8 | -2,001.6 | -1,985.0 | -1,643.6 | -1,867.7 | -1,943.2 | -2,021.8 | -2,103.6 | -2,188.6 |
| Capital Expenditure, % | -5.16 | -4.55 | -7.09 | -6.58 | -5.24 | -5.72 | -5.72 | -5.72 | -5.72 | -5.72 |
| Tax Rate, % | 26.69 | 26.69 | 26.69 | 26.69 | 26.69 | 26.69 | 26.69 | 26.69 | 26.69 | 26.69 |
| EBITAT | 1,901.9 | 4,438.9 | 4,527.8 | 3,616.3 | 3,419.0 | 4,494.6 | 4,676.4 | 4,865.5 | 5,062.3 | 5,267.0 |
| Depreciation | ||||||||||
| Changes in Account Receivables | ||||||||||
| Changes in Inventories | ||||||||||
| Changes in Accounts Payable | ||||||||||
| Capital Expenditure | ||||||||||
| UFCF | 1,272.9 | 4,220.2 | 3,244.2 | 3,558.5 | 3,657.4 | 4,876.4 | 4,751.3 | 4,943.5 | 5,143.4 | 5,351.5 |
| WACC, % | 8.06 | 8.06 | 8.06 | 8.06 | 8.06 | 8.06 | 8.06 | 8.06 | 8.06 | 8.06 |
| PV UFCF | ||||||||||
| SUM PV UFCF | 19,902.5 | |||||||||
| Long Term Growth Rate, % | 3.00 | |||||||||
| Free cash flow (T + 1) | 5,512 | |||||||||
| Terminal Value | 108,887 | |||||||||
| Present Terminal Value | 73,894 | |||||||||
| Enterprise Value | 93,796 | |||||||||
| Net Debt | -6,083 | |||||||||
| Equity Value | 99,879 | |||||||||
| Diluted Shares Outstanding, MM | 2,586 | |||||||||
| Equity Value Per Share | 38.63 |
What You Will Receive
- Genuine Li Ning Financial Data: Comprehensive historical and projected data for precise valuation.
- Customizable Parameters: Adjust WACC, tax rates, anticipated revenue growth, and capital expenditures.
- Real-Time Calculations: Intrinsic value and NPV are calculated on-the-fly.
- Scenario Simulation: Explore various scenarios to assess Li Ning's future performance.
- User-Friendly Design: Designed for professionals but easy enough for newcomers to use.
Key Features
- Pre-Loaded Data: Historical financial statements and pre-filled forecasts for Li Ning Company Limited (2331HK).
- Fully Adjustable Inputs: Customize WACC, tax rates, revenue growth, and EBITDA margins as needed.
- Instant Results: Witness the recalibration of Li Ning Company Limited (2331HK)’s intrinsic value in real time.
- Clear Visual Outputs: Intuitive dashboard charts present valuation results and essential metrics.
- Built for Accuracy: A professional-grade tool designed for analysts, investors, and finance professionals.
How It Works
- Step 1: Download the prebuilt Excel template featuring Li Ning Company Limited’s (2331HK) data.
- Step 2: Navigate through the pre-filled sheets to familiarize yourself with the essential metrics.
- Step 3: Modify forecasts and assumptions in the editable yellow cells (WACC, growth, margins).
- Step 4: Instantly access recalibrated results, including the intrinsic value of Li Ning Company Limited (2331HK).
- Step 5: Utilize the outputs to make informed investment decisions or create comprehensive reports.
Why Choose This Calculator for Li Ning Company Limited (2331HK)?
- Precision: Utilize authentic Li Ning financials for data reliability.
- Versatility: Crafted to allow users to experiment and adjust inputs easily.
- Efficiency: Avoid the complexities of constructing a DCF model from the ground up.
- High-Quality: Designed with the accuracy and usability expectations of CFOs in mind.
- User-Friendly: Intuitive interface, perfect for users with varying levels of financial modeling expertise.
Who Should Consider Using This Product?
- Individual Investors: Gain insights to make informed decisions regarding the buying or selling of Li Ning Company Limited (2331HK) shares.
- Financial Analysts: Enhance valuation accuracy with ready-to-implement financial models tailored for Li Ning Company Limited (2331HK).
- Consultants: Provide valuable valuation insights to clients related to Li Ning Company Limited (2331HK) swiftly and precisely.
- Business Owners: Learn how major companies like Li Ning Company Limited (2331HK) are valued to inform your own business strategies.
- Finance Students: Acquire practical valuation skills by analyzing real-world data and scenarios, including those of Li Ning Company Limited (2331HK).
Contents of the Template
- Comprehensive DCF Model: An editable template featuring detailed valuation calculations.
- Real-World Data: Li Ning Company Limited’s (2331HK) historical and projected financials preloaded for analysis.
- Customizable Parameters: Modify WACC, growth rates, and tax assumptions to explore various scenarios.
- Financial Statements: Complete annual and quarterly breakdowns for enhanced insights.
- Key Ratios: Integrated analysis for profitability, efficiency, and leverage metrics.
- Dashboard with Visual Outputs: Charts and tables that present clear, actionable results.
Disclaimer
All information, articles, and product details provided on this website are for general informational and educational purposes only. We do not claim any ownership over, nor do we intend to infringe upon, any trademarks, copyrights, logos, brand names, or other intellectual property mentioned or depicted on this site. Such intellectual property remains the property of its respective owners, and any references here are made solely for identification or informational purposes, without implying any affiliation, endorsement, or partnership.
We make no representations or warranties, express or implied, regarding the accuracy, completeness, or suitability of any content or products presented. Nothing on this website should be construed as legal, tax, investment, financial, medical, or other professional advice. In addition, no part of this site—including articles or product references—constitutes a solicitation, recommendation, endorsement, advertisement, or offer to buy or sell any securities, franchises, or other financial instruments, particularly in jurisdictions where such activity would be unlawful.
All content is of a general nature and may not address the specific circumstances of any individual or entity. It is not a substitute for professional advice or services. Any actions you take based on the information provided here are strictly at your own risk. You accept full responsibility for any decisions or outcomes arising from your use of this website and agree to release us from any liability in connection with your use of, or reliance upon, the content or products found herein.