
|
Wuxi Apptec Co., Ltd. (2359.HK) Avaliação DCF |
Totalmente Editável: Adapte-Se Às Suas Necessidades No Excel Ou Planilhas
Design Profissional: Modelos Confiáveis E Padrão Da Indústria
Pré-Construídos Para Uso Rápido E Eficiente
Compatível com MAC/PC, totalmente desbloqueado
Não É Necessária Experiência; Fácil De Seguir
WuXi AppTec Co., Ltd. (2359.HK) Bundle
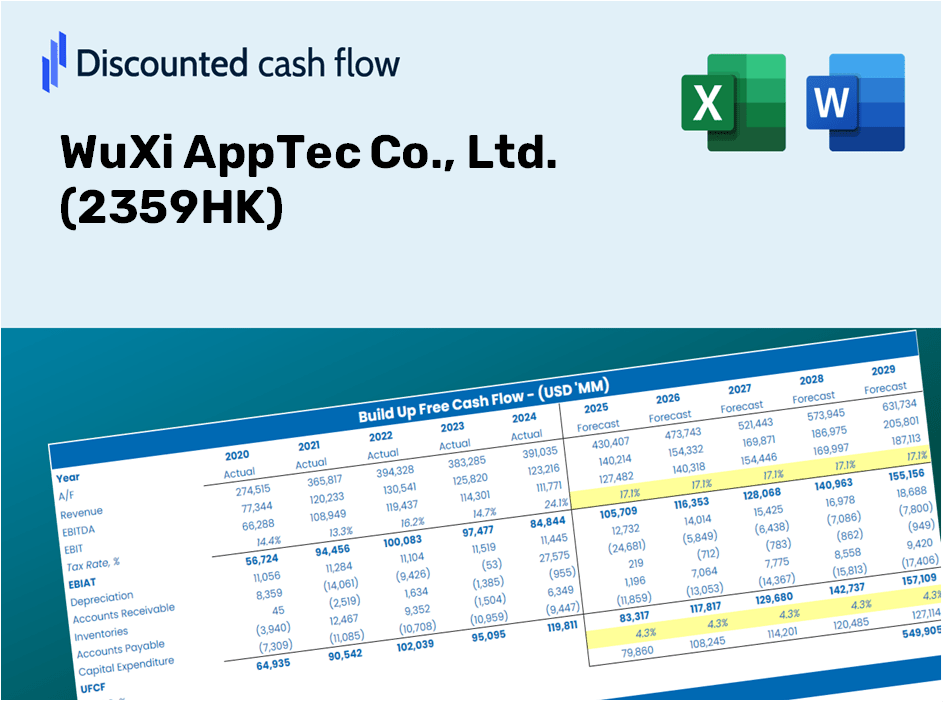
Ganhe informações sobre sua análise de avaliação Wuxi Apptec Co., Ltd. (2359HK) usando nossa sofisticada calculadora DCF! Este modelo do Excel é pré -carregado com dados reais (2359HK), permitindo que você ajuste as previsões e suposições para um cálculo preciso do valor intrínseco da Wuxi Apptec.
Discounted Cash Flow (DCF) - (USD MM)
| Year | AY1 2020 |
AY2 2021 |
AY3 2022 |
AY4 2023 |
AY5 2024 |
FY1 2025 |
FY2 2026 |
FY3 2027 |
FY4 2028 |
FY5 2029 |
|---|---|---|---|---|---|---|---|---|---|---|
| Revenue | 18,031.9 | 24,975.1 | 42,916.4 | 43,991.7 | 42,792.8 | 54,573.9 | 69,598.4 | 88,759.2 | 113,195.1 | 144,358.4 |
| Revenue Growth, % | 0 | 38.5 | 71.84 | 2.51 | -2.73 | 27.53 | 27.53 | 27.53 | 27.53 | 27.53 |
| EBITDA | 4,922.7 | 8,036.4 | 13,543.4 | 15,451.5 | 15,853.7 | 17,813.7 | 22,717.9 | 28,972.2 | 36,948.4 | 47,120.6 |
| EBITDA, % | 27.3 | 32.18 | 31.56 | 35.12 | 37.05 | 32.64 | 32.64 | 32.64 | 32.64 | 32.64 |
| Depreciation | 1,093.8 | 1,402.1 | 1,846.7 | 2,490.2 | 3,034.0 | 3,136.2 | 3,999.6 | 5,100.7 | 6,505.0 | 8,295.8 |
| Depreciation, % | 6.07 | 5.61 | 4.3 | 5.66 | 7.09 | 5.75 | 5.75 | 5.75 | 5.75 | 5.75 |
| EBIT | 3,829.0 | 6,634.3 | 11,696.7 | 12,961.2 | 12,819.8 | 14,677.5 | 18,718.3 | 23,871.5 | 30,443.5 | 38,824.7 |
| EBIT, % | 21.23 | 26.56 | 27.25 | 29.46 | 29.96 | 26.89 | 26.89 | 26.89 | 26.89 | 26.89 |
| Total Cash | 16,199.3 | 9,559.4 | 8,710.6 | 15,878.6 | 21,325.9 | 25,577.6 | 32,619.2 | 41,599.5 | 53,052.1 | 67,657.6 |
| Total Cash, percent | .0 | .0 | .0 | .0 | .0 | .0 | .0 | .0 | .0 | .0 |
| Account Receivables | 4,627.2 | 6,303.7 | 7,922.3 | 9,984.6 | 9,985.8 | 12,594.9 | 16,062.3 | 20,484.3 | 26,123.8 | 33,315.8 |
| Account Receivables, % | 25.66 | 25.24 | 18.46 | 22.7 | 23.34 | 23.08 | 23.08 | 23.08 | 23.08 | 23.08 |
| Inventories | 2,928.9 | 6,439.4 | 6,181.6 | 5,164.9 | 5,888.4 | 8,942.6 | 11,404.5 | 14,544.3 | 18,548.4 | 23,654.9 |
| Inventories, % | 16.24 | 25.78 | 14.4 | 11.74 | 13.76 | 16.39 | 16.39 | 16.39 | 16.39 | 16.39 |
| Accounts Payable | 1,026.6 | 2,105.8 | 1,809.5 | 1,794.2 | 1,924.1 | 2,937.8 | 3,746.6 | 4,778.1 | 6,093.5 | 7,771.0 |
| Accounts Payable, % | 5.69 | 8.43 | 4.22 | 4.08 | 4.5 | 5.38 | 5.38 | 5.38 | 5.38 | 5.38 |
| Capital Expenditure | -3,305.3 | -7,563.8 | -10,867.6 | -6,015.8 | -4,365.8 | -10,676.4 | -13,615.6 | -17,364.1 | -22,144.5 | -28,241.0 |
| Capital Expenditure, % | -18.33 | -30.29 | -25.32 | -13.67 | -10.2 | -19.56 | -19.56 | -19.56 | -19.56 | -19.56 |
| Tax Rate, % | 18.11 | 18.11 | 18.11 | 18.11 | 18.11 | 18.11 | 18.11 | 18.11 | 18.11 | 18.11 |
| EBITAT | 3,364.0 | 5,621.4 | 9,708.7 | 10,523.6 | 10,498.5 | 12,290.3 | 15,673.9 | 19,989.0 | 25,492.1 | 32,510.2 |
| Depreciation | ||||||||||
| Changes in Account Receivables | ||||||||||
| Changes in Inventories | ||||||||||
| Changes in Accounts Payable | ||||||||||
| Capital Expenditure | ||||||||||
| UFCF | -5,377.1 | -4,648.1 | -969.3 | 5,937.3 | 8,571.8 | 100.6 | 937.3 | 1,195.3 | 1,524.4 | 1,944.0 |
| WACC, % | 7.06 | 7.05 | 7.05 | 7.05 | 7.05 | 7.05 | 7.05 | 7.05 | 7.05 | 7.05 |
| PV UFCF | ||||||||||
| SUM PV UFCF | 4,429.2 | |||||||||
| Long Term Growth Rate, % | 2.00 | |||||||||
| Free cash flow (T + 1) | 1,983 | |||||||||
| Terminal Value | 39,233 | |||||||||
| Present Terminal Value | 27,902 | |||||||||
| Enterprise Value | 32,331 | |||||||||
| Net Debt | -14,802 | |||||||||
| Equity Value | 47,133 | |||||||||
| Diluted Shares Outstanding, MM | 2,903 | |||||||||
| Equity Value Per Share | 16.24 |
What You Will Receive
- Genuine WuXi AppTec Data: Comprehensive financials – encompassing revenue to EBIT – derived from actual and projected metrics.
- Complete Customization: Modify all key variables (yellow cells) such as WACC, growth %, and tax rates.
- Real-Time Valuation Updates: Automatic recalculations to assess the impact of changes on WuXi AppTec’s fair value.
- Flexible Excel Template: Designed for quick adjustments, scenario analysis, and detailed forecasting.
- Efficient and Precise: Avoid constructing models from the ground up while ensuring accuracy and adaptability.
Key Features
- Pre-Loaded Data: Historical financial statements and pre-filled forecasts for WuXi AppTec Co., Ltd. (2359HK).
- Fully Adjustable Inputs: Customize WACC, tax rates, revenue growth, and EBITDA margins to fit your analysis.
- Instant Results: View the intrinsic value of WuXi AppTec Co., Ltd. (2359HK) recalculated in real time.
- Clear Visual Outputs: Engaging dashboard charts illustrate valuation outcomes and essential metrics.
- Built for Accuracy: A professional-grade tool designed for analysts, investors, and finance professionals.
How It Works
- Step 1: Download the prebuilt Excel template with WuXi AppTec's data included.
- Step 2: Explore the pre-filled sheets to familiarize yourself with the key metrics.
- Step 3: Modify forecasts and assumptions in the editable yellow cells (WACC, growth, margins).
- Step 4: Immediately view recalculated results, including WuXi AppTec's intrinsic value.
- Step 5: Utilize the outputs to make informed investment decisions or generate reports.
Why Choose This Calculator for WuXi AppTec Co., Ltd. (2359HK)?
- Reliable Data: Utilizes authentic WuXi AppTec financials for dependable valuation insights.
- Customizable Options: Tailor essential parameters such as growth rates, WACC, and tax rates to align with your forecasts.
- Efficiency Boost: Pre-configured calculations save you from starting from the ground up.
- Professional-Quality Tool: Crafted for investors, analysts, and consultants in the biotech sector.
- Easy to Use: User-friendly design and detailed guidance simplify the process for everyone.
Who Should Use WuXi AppTec Co., Ltd. (2359HK)?
- Individual Investors: Gain insights to make informed choices about investing in WuXi AppTec Co., Ltd. (2359HK).
- Financial Analysts: Enhance valuation processes with comprehensive financial models tailored for WuXi AppTec Co., Ltd. (2359HK).
- Consultants: Provide clients with accurate and timely valuation insights regarding WuXi AppTec Co., Ltd. (2359HK).
- Business Owners: Learn how leading biotech firms like WuXi AppTec Co., Ltd. (2359HK) are valued to inform your own business strategies.
- Finance Students: Explore valuation methodologies utilizing real-world data and case studies related to WuXi AppTec Co., Ltd. (2359HK).
Contents of the Template
- Operating and Balance Sheet Data: Pre-filled historical data and forecasts for WuXi AppTec Co., Ltd. (2359HK), including revenue, EBITDA, EBIT, and capital expenditures.
- WACC Calculation: A dedicated sheet for calculating the Weighted Average Cost of Capital (WACC), featuring parameters such as Beta, risk-free rate, and share price.
- DCF Valuation (Unlevered and Levered): Editable Discounted Cash Flow models that present intrinsic value along with comprehensive calculations.
- Financial Statements: Pre-loaded annual and quarterly financial statements to aid in analysis.
- Key Ratios: A collection of profitability, leverage, and efficiency ratios specifically for WuXi AppTec Co., Ltd. (2359HK).
- Dashboard and Charts: A visual summary showcasing valuation outputs and assumptions for straightforward analysis of results.
Disclaimer
All information, articles, and product details provided on this website are for general informational and educational purposes only. We do not claim any ownership over, nor do we intend to infringe upon, any trademarks, copyrights, logos, brand names, or other intellectual property mentioned or depicted on this site. Such intellectual property remains the property of its respective owners, and any references here are made solely for identification or informational purposes, without implying any affiliation, endorsement, or partnership.
We make no representations or warranties, express or implied, regarding the accuracy, completeness, or suitability of any content or products presented. Nothing on this website should be construed as legal, tax, investment, financial, medical, or other professional advice. In addition, no part of this site—including articles or product references—constitutes a solicitation, recommendation, endorsement, advertisement, or offer to buy or sell any securities, franchises, or other financial instruments, particularly in jurisdictions where such activity would be unlawful.
All content is of a general nature and may not address the specific circumstances of any individual or entity. It is not a substitute for professional advice or services. Any actions you take based on the information provided here are strictly at your own risk. You accept full responsibility for any decisions or outcomes arising from your use of this website and agree to release us from any liability in connection with your use of, or reliance upon, the content or products found herein.