
|
Kakaku.com, Inc. (2371.T) Avaliação DCF |
Totalmente Editável: Adapte-Se Às Suas Necessidades No Excel Ou Planilhas
Design Profissional: Modelos Confiáveis E Padrão Da Indústria
Pré-Construídos Para Uso Rápido E Eficiente
Compatível com MAC/PC, totalmente desbloqueado
Não É Necessária Experiência; Fácil De Seguir
Kakaku.com, Inc. (2371.T) Bundle
Descubra o verdadeiro valor de Kakaku.com, Inc. (2371T) com nossa calculadora DCF de nível profissional! Ajuste as principais suposições, explore vários cenários e avalie como as mudanças afetam a avaliação Kakaku.com, Inc. (2371T) - tudo dentro de um modelo conveniente do Excel.
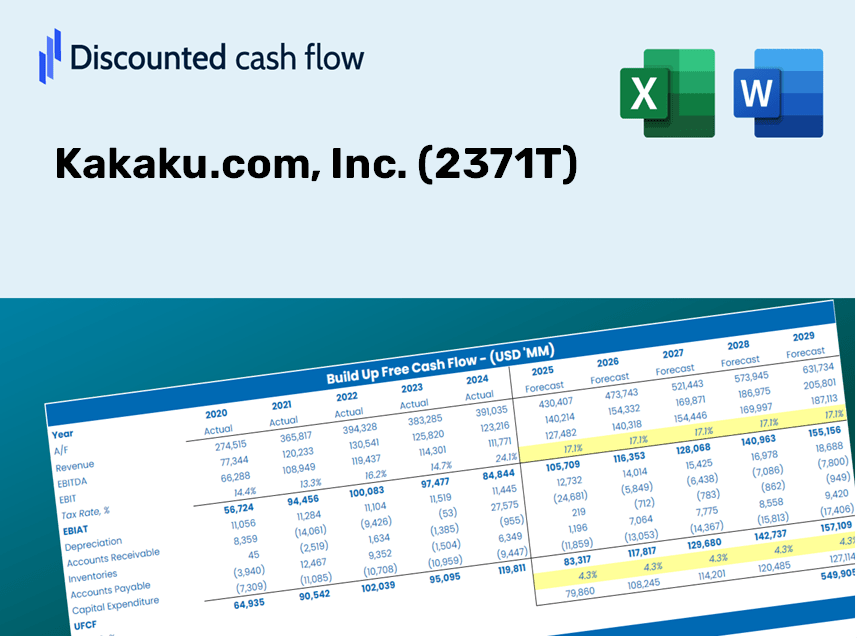
Discounted Cash Flow (DCF) - (USD MM)
| Year | AY1 2021 |
AY2 2022 |
AY3 2023 |
AY4 2024 |
AY5 2025 |
FY1 2026 |
FY2 2027 |
FY3 2028 |
FY4 2029 |
FY5 2030 |
|---|---|---|---|---|---|---|---|---|---|---|
| Revenue | 51,077.0 | 51,723.0 | 60,820.0 | 66,928.0 | 78,435.0 | 87,472.4 | 97,551.1 | 108,791.0 | 121,326.1 | 135,305.4 |
| Revenue Growth, % | 0 | 1.26 | 17.59 | 10.04 | 17.19 | 11.52 | 11.52 | 11.52 | 11.52 | 11.52 |
| EBITDA | 21,583.0 | 22,650.0 | 26,978.0 | 29,760.0 | 33,233.0 | 38,004.9 | 42,383.9 | 47,267.5 | 52,713.7 | 58,787.4 |
| EBITDA, % | 42.26 | 43.79 | 44.36 | 44.47 | 42.37 | 43.45 | 43.45 | 43.45 | 43.45 | 43.45 |
| Depreciation | 3,573.0 | 3,506.0 | 3,565.0 | 3,671.0 | 3,915.0 | 5,267.9 | 5,874.9 | 6,551.8 | 7,306.7 | 8,148.5 |
| Depreciation, % | 7 | 6.78 | 5.86 | 5.48 | 4.99 | 6.02 | 6.02 | 6.02 | 6.02 | 6.02 |
| EBIT | 18,010.0 | 19,144.0 | 23,413.0 | 26,089.0 | 29,318.0 | 32,737.1 | 36,509.1 | 40,715.7 | 45,407.0 | 50,638.9 |
| EBIT, % | 35.26 | 37.01 | 38.5 | 38.98 | 37.38 | 37.43 | 37.43 | 37.43 | 37.43 | 37.43 |
| Total Cash | 35,572.0 | 34,550.0 | 36,983.0 | 38,144.0 | 50,859.0 | 55,822.1 | 62,254.0 | 69,427.0 | 77,426.5 | 86,347.6 |
| Total Cash, percent | .0 | .0 | .0 | .0 | .0 | .0 | .0 | .0 | .0 | .0 |
| Account Receivables | 7,672.0 | 7,919.0 | 10,039.0 | 11,808.0 | 13,328.0 | 14,253.1 | 15,895.4 | 17,726.9 | 19,769.4 | 22,047.3 |
| Account Receivables, % | 15.02 | 15.31 | 16.51 | 17.64 | 16.99 | 16.29 | 16.29 | 16.29 | 16.29 | 16.29 |
| Inventories | .0 | .0 | .0 | .0 | .0 | .0 | .0 | .0 | .0 | .0 |
| Inventories, % | 0 | 0 | 0 | 0 | 0 | 0 | 0 | 0 | 0 | 0 |
| Accounts Payable | 2,400.0 | 2,939.0 | 3,616.0 | 4,189.0 | 5,159.0 | 5,101.9 | 5,689.7 | 6,345.3 | 7,076.4 | 7,891.8 |
| Accounts Payable, % | 4.7 | 5.68 | 5.95 | 6.26 | 6.58 | 5.83 | 5.83 | 5.83 | 5.83 | 5.83 |
| Capital Expenditure | -2,201.0 | -1,774.0 | -1,999.0 | -2,096.0 | -698.0 | -2,632.5 | -2,935.8 | -3,274.0 | -3,651.3 | -4,072.0 |
| Capital Expenditure, % | -4.31 | -3.43 | -3.29 | -3.13 | -0.88991 | -3.01 | -3.01 | -3.01 | -3.01 | -3.01 |
| Tax Rate, % | 30.28 | 30.28 | 30.28 | 30.28 | 30.28 | 30.28 | 30.28 | 30.28 | 30.28 | 30.28 |
| EBITAT | 11,832.6 | 13,094.9 | 16,263.1 | 18,072.1 | 20,439.1 | 22,428.2 | 25,012.4 | 27,894.4 | 31,108.4 | 34,692.8 |
| Depreciation | ||||||||||
| Changes in Account Receivables | ||||||||||
| Changes in Inventories | ||||||||||
| Changes in Accounts Payable | ||||||||||
| Capital Expenditure | ||||||||||
| UFCF | 7,932.6 | 15,118.9 | 16,386.1 | 18,451.1 | 23,106.1 | 24,081.4 | 26,897.1 | 29,996.2 | 33,452.4 | 37,306.9 |
| WACC, % | 7.26 | 7.27 | 7.27 | 7.27 | 7.27 | 7.27 | 7.27 | 7.27 | 7.27 | 7.27 |
| PV UFCF | ||||||||||
| SUM PV UFCF | 121,670.3 | |||||||||
| Long Term Growth Rate, % | 2.00 | |||||||||
| Free cash flow (T + 1) | 38,053 | |||||||||
| Terminal Value | 722,608 | |||||||||
| Present Terminal Value | 508,852 | |||||||||
| Enterprise Value | 630,522 | |||||||||
| Net Debt | -46,609 | |||||||||
| Equity Value | 677,131 | |||||||||
| Diluted Shares Outstanding, MM | 198 | |||||||||
| Equity Value Per Share | 3,423.69 |
Benefits You Will Receive
- Adjustable Forecast Parameters: Seamlessly modify assumptions (growth %, profit margins, WACC) to generate various scenarios.
- Real-Time Data: Kakaku.com, Inc.’s financial statistics pre-loaded to enhance your analysis.
- Automated DCF Calculations: The template automatically computes Net Present Value (NPV) and intrinsic value for your convenience.
- Customizable and Professional Design: A refined Excel model tailored to fit your valuation requirements.
- Designed for Analysts and Investors: Perfect for evaluating projections, validating strategies, and optimizing time efficiency.
Key Features
- Customizable Forecast Inputs: Adjust essential variables such as revenue growth, EBITDA percentage, and capital investments.
- Instant DCF Valuation: Quickly determines intrinsic value, NPV, and additional metrics with ease.
- Industry-Leading Precision: Leverages Kakaku.com, Inc.'s (2371T) real financial data for accurate valuation results.
- Effortless Scenario Analysis: Easily evaluate varying assumptions and compare different outcomes.
- Efficiency Booster: Save time by avoiding the complexities of building intricate valuation models from the ground up.
How It Operates
- Download the Template: Gain immediate access to the Excel-based Kakaku.com, Inc. (2371T) DCF Calculator.
- Input Your Assumptions: Modify the yellow-highlighted cells to set your growth rates, WACC, margins, and other parameters.
- Instant Calculations: The model automatically recalculates Kakaku.com’s intrinsic value.
- Test Scenarios: Experiment with various assumptions to assess potential changes in valuation.
- Analyze and Decide: Utilize the results to inform your investment strategies or financial evaluations.
Why Opt for Kakaku.com, Inc. (2371T) Calculator?
- Time-Saving: Skip the hassle of building a DCF model from the ground up – it’s fully prepared for you.
- Enhanced Accuracy: Dependable financial data and formulas help minimize valuation errors.
- Completely Customizable: Modify the model to align with your specific assumptions and forecasts.
- User-Friendly: Intuitive charts and outputs simplify the analysis of results.
- Expert Approved: Crafted for professionals who prioritize both precision and functionality.
Who Can Benefit from Kakaku.com, Inc. (2371T)?
- Individual Investors: Gain insights to make strategic decisions on investing in Kakaku.com, Inc. (2371T) shares.
- Financial Analysts: Enhance valuation efforts with comprehensive financial models tailored for Kakaku.com, Inc. (2371T).
- Consultants: Provide clients with accurate and timely valuation assessments regarding Kakaku.com, Inc. (2371T).
- Business Owners: Learn about the valuation practices of prominent companies like Kakaku.com, Inc. (2371T) to inform your business strategies.
- Finance Students: Apply real-world data and scenarios to master valuation techniques related to Kakaku.com, Inc. (2371T).
Contents of the Template
- Operating and Balance Sheet Data: Pre-filled Kakaku.com, Inc. historical data and forecasts, including revenue, EBITDA, EBIT, and capital expenditures.
- WACC Calculation: A separate sheet for Weighted Average Cost of Capital (WACC), incorporating parameters such as Beta, risk-free rate, and share price.
- DCF Valuation (Unlevered and Levered): Customizable Discounted Cash Flow models that present intrinsic value with comprehensive calculations.
- Financial Statements: Pre-loaded financial statements (annual and quarterly) to facilitate thorough analysis.
- Key Ratios: Includes profitability, leverage, and efficiency ratios specific to Kakaku.com, Inc. (2371T).
- Dashboard and Charts: Visual representation of valuation outcomes and assumptions for easy result analysis.
Disclaimer
All information, articles, and product details provided on this website are for general informational and educational purposes only. We do not claim any ownership over, nor do we intend to infringe upon, any trademarks, copyrights, logos, brand names, or other intellectual property mentioned or depicted on this site. Such intellectual property remains the property of its respective owners, and any references here are made solely for identification or informational purposes, without implying any affiliation, endorsement, or partnership.
We make no representations or warranties, express or implied, regarding the accuracy, completeness, or suitability of any content or products presented. Nothing on this website should be construed as legal, tax, investment, financial, medical, or other professional advice. In addition, no part of this site—including articles or product references—constitutes a solicitation, recommendation, endorsement, advertisement, or offer to buy or sell any securities, franchises, or other financial instruments, particularly in jurisdictions where such activity would be unlawful.
All content is of a general nature and may not address the specific circumstances of any individual or entity. It is not a substitute for professional advice or services. Any actions you take based on the information provided here are strictly at your own risk. You accept full responsibility for any decisions or outcomes arising from your use of this website and agree to release us from any liability in connection with your use of, or reliance upon, the content or products found herein.