
|
DIP Corporation (2379.T) Avaliação DCF |
Totalmente Editável: Adapte-Se Às Suas Necessidades No Excel Ou Planilhas
Design Profissional: Modelos Confiáveis E Padrão Da Indústria
Pré-Construídos Para Uso Rápido E Eficiente
Compatível com MAC/PC, totalmente desbloqueado
Não É Necessária Experiência; Fácil De Seguir
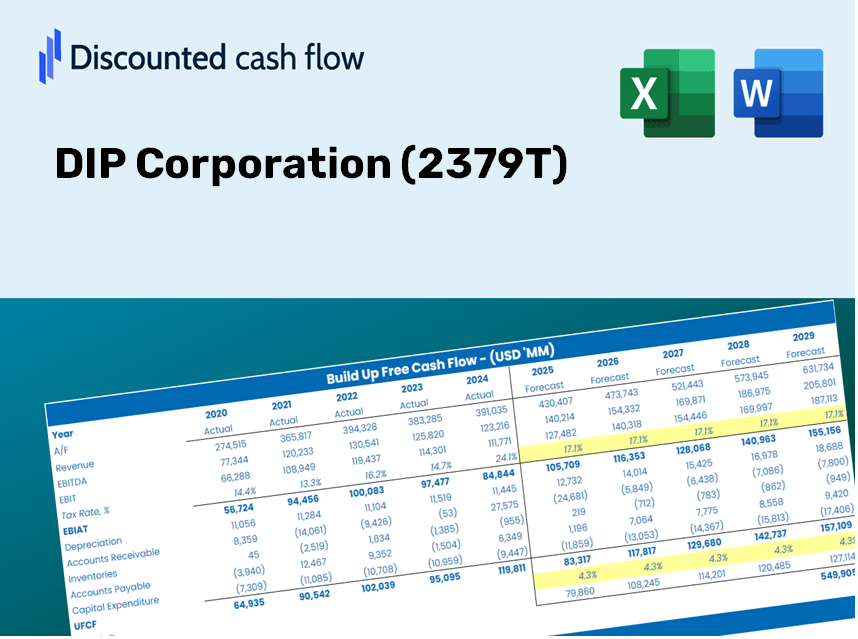
DIP Corporation (2379.T) Bundle
Explore o futuro financeiro da Dip Corporation (2379T) com nossa calculadora DCF amigável! Digite suas projeções de crescimento, margens e despesas para calcular o valor intrínseco da Dip Corporation (2379T) e aprimore sua estratégia de investimento.
Discounted Cash Flow (DCF) - (USD MM)
| Year | AY1 2020 |
AY2 2021 |
AY3 2022 |
AY4 2023 |
AY5 2024 |
FY1 2025 |
FY2 2026 |
FY3 2027 |
FY4 2028 |
FY5 2029 |
|---|---|---|---|---|---|---|---|---|---|---|
| Revenue | 32,494.8 | 39,515.3 | 49,355.7 | 53,782.3 | 56,386.2 | 64,889.0 | 74,673.9 | 85,934.4 | 98,893.0 | 113,805.6 |
| Revenue Growth, % | 0 | 21.61 | 24.9 | 8.97 | 4.84 | 15.08 | 15.08 | 15.08 | 15.08 | 15.08 |
| EBITDA | 9,311.8 | 8,055.3 | 14,269.6 | 15,828.0 | 16,626.4 | 17,762.7 | 20,441.2 | 23,523.7 | 27,070.9 | 31,153.1 |
| EBITDA, % | 28.66 | 20.39 | 28.91 | 29.43 | 29.49 | 27.37 | 27.37 | 27.37 | 27.37 | 27.37 |
| Depreciation | 1,999.7 | 2,452.9 | 2,731.4 | 3,066.8 | 3,577.5 | 3,885.9 | 4,471.8 | 5,146.1 | 5,922.2 | 6,815.2 |
| Depreciation, % | 6.15 | 6.21 | 5.53 | 5.7 | 6.34 | 5.99 | 5.99 | 5.99 | 5.99 | 5.99 |
| EBIT | 7,312.2 | 5,602.4 | 11,538.2 | 12,761.2 | 13,048.9 | 13,876.8 | 15,969.4 | 18,377.5 | 21,148.8 | 24,337.9 |
| EBIT, % | 22.5 | 14.18 | 23.38 | 23.73 | 23.14 | 21.39 | 21.39 | 21.39 | 21.39 | 21.39 |
| Total Cash | 12,462.7 | 16,569.5 | 21,974.4 | 19,116.8 | 18,156.2 | 24,989.0 | 28,757.2 | 33,093.7 | 38,084.1 | 43,827.0 |
| Total Cash, percent | .0 | .0 | .0 | .0 | .0 | .0 | .0 | .0 | .0 | .0 |
| Account Receivables | 3,451.8 | 4,770.1 | 5,369.4 | 5,613.7 | 5,425.9 | 6,960.5 | 8,010.1 | 9,218.0 | 10,608.0 | 12,207.7 |
| Account Receivables, % | 10.62 | 12.07 | 10.88 | 10.44 | 9.62 | 10.73 | 10.73 | 10.73 | 10.73 | 10.73 |
| Inventories | 5.4 | 14.7 | 8.3 | 20.0 | 12.0 | 16.7 | 19.3 | 22.2 | 25.5 | 29.3 |
| Inventories, % | 0.01668269 | 0.03712993 | 0.01673971 | 0.03709771 | 0.02128713 | 0.02578743 | 0.02578743 | 0.02578743 | 0.02578743 | 0.02578743 |
| Accounts Payable | 283.3 | 398.7 | 438.3 | 454.8 | 427.6 | 567.5 | 653.1 | 751.6 | 864.9 | 995.3 |
| Accounts Payable, % | 0.87193 | 1.01 | 0.88807 | 0.84569 | 0.75835 | 0.87458 | 0.87458 | 0.87458 | 0.87458 | 0.87458 |
| Capital Expenditure | -3,368.5 | -3,804.3 | -3,631.7 | -4,122.9 | -450.1 | -4,648.2 | -5,349.1 | -6,155.7 | -7,084.0 | -8,152.2 |
| Capital Expenditure, % | -10.37 | -9.63 | -7.36 | -7.67 | -0.79826 | -7.16 | -7.16 | -7.16 | -7.16 | -7.16 |
| Tax Rate, % | 31.4 | 31.4 | 31.4 | 31.4 | 31.4 | 31.4 | 31.4 | 31.4 | 31.4 | 31.4 |
| EBITAT | 3,898.9 | 3,910.6 | 8,193.7 | 9,636.9 | 8,951.3 | 9,387.7 | 10,803.4 | 12,432.5 | 14,307.2 | 16,464.7 |
| Depreciation | ||||||||||
| Changes in Account Receivables | ||||||||||
| Changes in Inventories | ||||||||||
| Changes in Accounts Payable | ||||||||||
| Capital Expenditure | ||||||||||
| UFCF | -643.8 | 1,347.0 | 6,740.1 | 8,341.3 | 12,247.1 | 7,226.0 | 8,959.5 | 10,310.6 | 11,865.4 | 13,654.6 |
| WACC, % | 5.01 | 5.01 | 5.01 | 5.01 | 5.01 | 5.01 | 5.01 | 5.01 | 5.01 | 5.01 |
| PV UFCF | ||||||||||
| SUM PV UFCF | 44,361.1 | |||||||||
| Long Term Growth Rate, % | 3.00 | |||||||||
| Free cash flow (T + 1) | 14,064 | |||||||||
| Terminal Value | 699,465 | |||||||||
| Present Terminal Value | 547,769 | |||||||||
| Enterprise Value | 592,130 | |||||||||
| Net Debt | -18,156 | |||||||||
| Equity Value | 610,286 | |||||||||
| Diluted Shares Outstanding, MM | 53 | |||||||||
| Equity Value Per Share | 11,476.07 |
What You Will Receive
- Customizable Excel Template: A fully adjustable Excel-based DCF Calculator featuring pre-filled financial data for DIP Corporation (2379T).
- Actual Market Data: Access historical figures and forward-looking projections (highlighted in the yellow cells).
- Flexible Forecasting: Modify assumptions for key metrics such as revenue growth, EBITDA %, and WACC.
- Instant Calculations: Quickly observe how your adjustments affect the valuation of DIP Corporation (2379T).
- Professional-Grade Tool: Designed for investors, CFOs, consultants, and financial analysts.
- Intuitive Layout: Organized for simplicity and ease of navigation, complete with step-by-step guidelines.
Key Features
- Comprehensive DIP Data: Pre-loaded with DIP Corporation’s historical financial performance and future projections.
- Flexible Input Options: Tailor revenue growth, margins, WACC, tax rates, and capital expenditures to your preferences.
- Dynamic Valuation Framework: Automatic recalculations of Net Present Value (NPV) and intrinsic value based on your customized inputs.
- Scenario Analysis: Generate various forecasting scenarios to evaluate different valuation results.
- Intuitive User Interface: Designed for ease of use, catering to both professionals and newcomers.
How It Works
- Step 1: Download the prebuilt Excel template featuring DIP Corporation’s (2379T) data.
- Step 2: Review the pre-filled sheets to familiarize yourself with the key metrics.
- Step 3: Modify the forecasts and assumptions in the editable yellow cells (WACC, growth, margins).
- Step 4: Instantly see the recalculated results, including the intrinsic value of DIP Corporation (2379T).
- Step 5: Use the outputs to make informed investment decisions or create detailed reports.
Why Use the DIP Corporation Calculator?
- Designed for Experts: A sophisticated tool tailored for analysts, CFOs, and consultants.
- Comprehensive Data: DIP Corporation's historical and projected financial figures are preloaded for precision.
- Flexible Scenario Analysis: Effortlessly test various forecasts and assumptions.
- Transparent Results: Automatically computes intrinsic value, NPV, and essential metrics.
- User-Friendly: Clear, step-by-step guidance to facilitate your calculations.
Who Can Benefit from DIP Corporation (2379T)?
- Individual Investors: Gain insights for making educated decisions on buying or selling shares of DIP Corporation (2379T).
- Financial Analysts: Enhance valuation workflows with accessible financial models tailored for DIP Corporation (2379T).
- Consultants: Provide precise valuation analysis and insights to clients efficiently regarding DIP Corporation (2379T).
- Business Owners: Learn about the valuation of large firms like DIP Corporation (2379T) to refine your own business strategies.
- Finance Students: Master valuation methodologies using real data and practical examples from DIP Corporation (2379T).
Contents of the DIP Corporation Template
- Preloaded DIP Data: Historical and projected financial metrics, including revenue, EBIT, and capital expenditures.
- DCF and WACC Models: Advanced spreadsheets designed for determining intrinsic value and Weighted Average Cost of Capital.
- Editable Inputs: Yellow-highlighted cells to customize revenue growth, tax rates, and discount rates.
- Financial Statements: Detailed annual and quarterly financial reports for in-depth analysis.
- Key Ratios: Measures of profitability, leverage, and efficiency to assess performance.
- Dashboard and Charts: Visual representations of valuation results and key assumptions.
Disclaimer
All information, articles, and product details provided on this website are for general informational and educational purposes only. We do not claim any ownership over, nor do we intend to infringe upon, any trademarks, copyrights, logos, brand names, or other intellectual property mentioned or depicted on this site. Such intellectual property remains the property of its respective owners, and any references here are made solely for identification or informational purposes, without implying any affiliation, endorsement, or partnership.
We make no representations or warranties, express or implied, regarding the accuracy, completeness, or suitability of any content or products presented. Nothing on this website should be construed as legal, tax, investment, financial, medical, or other professional advice. In addition, no part of this site—including articles or product references—constitutes a solicitation, recommendation, endorsement, advertisement, or offer to buy or sell any securities, franchises, or other financial instruments, particularly in jurisdictions where such activity would be unlawful.
All content is of a general nature and may not address the specific circumstances of any individual or entity. It is not a substitute for professional advice or services. Any actions you take based on the information provided here are strictly at your own risk. You accept full responsibility for any decisions or outcomes arising from your use of this website and agree to release us from any liability in connection with your use of, or reliance upon, the content or products found herein.