
|
SINOPEC Engineering Co., Ltd. (2386.HK) Avaliação DCF |
Totalmente Editável: Adapte-Se Às Suas Necessidades No Excel Ou Planilhas
Design Profissional: Modelos Confiáveis E Padrão Da Indústria
Pré-Construídos Para Uso Rápido E Eficiente
Compatível com MAC/PC, totalmente desbloqueado
Não É Necessária Experiência; Fácil De Seguir
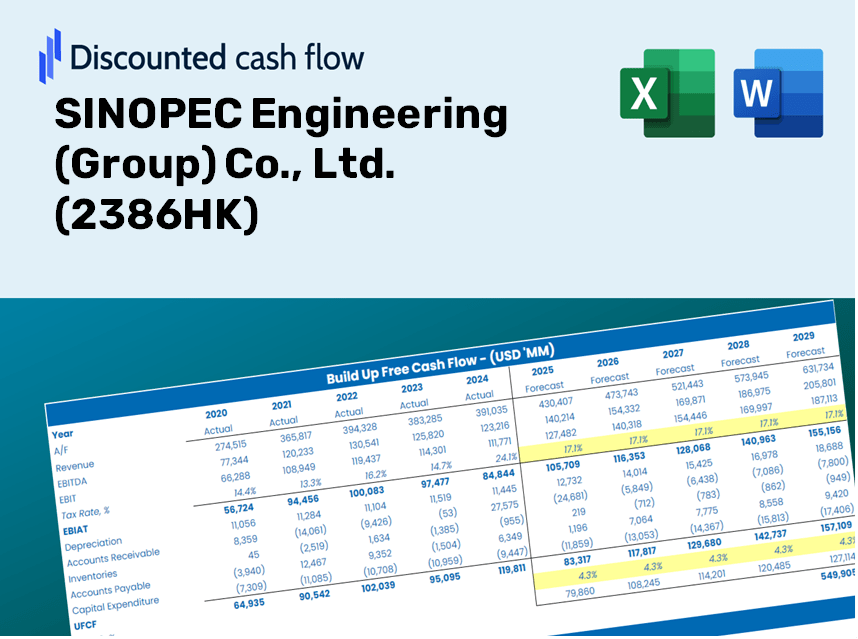
SINOPEC Engineering (Group) Co., Ltd. (2386.HK) Bundle
Procurando avaliar o valor intrínseco da Sinopec Engineering (Group) Co., Ltd.? Nossa calculadora DCF (2386HK) integra dados do mundo real com recursos abrangentes de personalização, permitindo refinar suas projeções e aprimorar suas decisões de investimento.
Discounted Cash Flow (DCF) - (USD MM)
| Year | AY1 2020 |
AY2 2021 |
AY3 2022 |
AY4 2023 |
AY5 2024 |
FY1 2025 |
FY2 2026 |
FY3 2027 |
FY4 2028 |
FY5 2029 |
|---|---|---|---|---|---|---|---|---|---|---|
| Revenue | 57,253.5 | 63,166.7 | 57,992.3 | 61,483.6 | 70,208.0 | 70,539.2 | 70,871.9 | 71,206.2 | 71,542.1 | 71,879.6 |
| Revenue Growth, % | 0 | 10.33 | -8.19 | 6.02 | 14.19 | 0.4717 | 0.4717 | 0.4717 | 0.4717 | 0.4717 |
| EBITDA | 2,931.5 | 2,539.5 | 2,413.5 | 4,140.9 | 4,351.4 | 3,701.2 | 3,718.7 | 3,736.2 | 3,753.9 | 3,771.6 |
| EBITDA, % | 5.12 | 4.02 | 4.16 | 6.73 | 6.2 | 5.25 | 5.25 | 5.25 | 5.25 | 5.25 |
| Depreciation | 528.2 | 726.9 | 765.8 | 1,039.4 | 1,158.2 | 950.0 | 954.5 | 959.0 | 963.5 | 968.1 |
| Depreciation, % | 0.92264 | 1.15 | 1.32 | 1.69 | 1.65 | 1.35 | 1.35 | 1.35 | 1.35 | 1.35 |
| EBIT | 2,403.3 | 1,812.7 | 1,647.7 | 3,101.5 | 3,193.3 | 2,751.2 | 2,764.2 | 2,777.2 | 2,790.3 | 2,803.5 |
| EBIT, % | 4.2 | 2.87 | 2.84 | 5.04 | 4.55 | 3.9 | 3.9 | 3.9 | 3.9 | 3.9 |
| Total Cash | 18,286.4 | 20,415.7 | 26,281.2 | 27,208.1 | 23,406.8 | 26,405.7 | 26,530.2 | 26,655.3 | 26,781.1 | 26,907.4 |
| Total Cash, percent | .0 | .0 | .0 | .0 | .0 | .0 | .0 | .0 | .0 | .0 |
| Account Receivables | 18,865.5 | 18,730.1 | 20,058.3 | 19,020.1 | 45,297.2 | 27,178.0 | 27,306.2 | 27,435.0 | 27,564.4 | 27,694.4 |
| Account Receivables, % | 32.95 | 29.65 | 34.59 | 30.94 | 64.52 | 38.53 | 38.53 | 38.53 | 38.53 | 38.53 |
| Inventories | 4,814.1 | 4,425.4 | 3,817.2 | 6,337.2 | 587.2 | 4,675.3 | 4,697.4 | 4,719.6 | 4,741.8 | 4,764.2 |
| Inventories, % | 8.41 | 7.01 | 6.58 | 10.31 | 0.83634 | 6.63 | 6.63 | 6.63 | 6.63 | 6.63 |
| Accounts Payable | 22,698.2 | 21,130.8 | 21,308.5 | 21,659.9 | 24,092.3 | 25,307.4 | 25,426.8 | 25,546.7 | 25,667.2 | 25,788.3 |
| Accounts Payable, % | 39.65 | 33.45 | 36.74 | 35.23 | 34.32 | 35.88 | 35.88 | 35.88 | 35.88 | 35.88 |
| Capital Expenditure | -444.7 | -711.8 | -774.9 | -433.2 | -386.8 | -634.2 | -637.2 | -640.2 | -643.2 | -646.2 |
| Capital Expenditure, % | -0.77667 | -1.13 | -1.34 | -0.70463 | -0.55099 | -0.89905 | -0.89905 | -0.89905 | -0.89905 | -0.89905 |
| Tax Rate, % | 13.54 | 13.54 | 13.54 | 13.54 | 13.54 | 13.54 | 13.54 | 13.54 | 13.54 | 13.54 |
| EBITAT | 1,901.4 | 1,489.1 | 1,363.1 | 2,620.5 | 2,760.9 | 2,283.2 | 2,294.0 | 2,304.8 | 2,315.7 | 2,326.6 |
| Depreciation | ||||||||||
| Changes in Account Receivables | ||||||||||
| Changes in Inventories | ||||||||||
| Changes in Accounts Payable | ||||||||||
| Capital Expenditure | ||||||||||
| UFCF | 1,003.6 | 460.8 | 811.8 | 2,096.3 | -14,562.5 | 17,845.2 | 2,580.4 | 2,592.6 | 2,604.8 | 2,617.1 |
| WACC, % | 6.07 | 6.08 | 6.08 | 6.09 | 6.09 | 6.08 | 6.08 | 6.08 | 6.08 | 6.08 |
| PV UFCF | ||||||||||
| SUM PV UFCF | 25,291.1 | |||||||||
| Long Term Growth Rate, % | 0.50 | |||||||||
| Free cash flow (T + 1) | 2,630 | |||||||||
| Terminal Value | 47,106 | |||||||||
| Present Terminal Value | 35,062 | |||||||||
| Enterprise Value | 60,353 | |||||||||
| Net Debt | -11,885 | |||||||||
| Equity Value | 72,238 | |||||||||
| Diluted Shares Outstanding, MM | 4,410 | |||||||||
| Equity Value Per Share | 16.38 |
Benefits You Will Receive
- Authentic SINOPEC Financial Data: Access comprehensive historical and projected figures for precise valuation.
- Customizable Parameters: Adjust inputs such as WACC, tax rates, revenue growth, and capital investments.
- Real-Time Calculations: Instantaneous computation of intrinsic value and NPV.
- Scenario Evaluation: Analyze multiple scenarios to assess SINOPEC's potential future performance.
- User-Friendly Design: Designed for industry professionals while remaining easy to navigate for newcomers.
Key Features
- 🔍 Real-Life SINOPEC Financials: Pre-filled historical and projected data for SINOPEC Engineering (Group) Co., Ltd. (2386HK).
- ✏️ Fully Customizable Inputs: Modify all essential parameters (yellow cells) such as WACC, growth %, and tax rates.
- 📊 Professional DCF Valuation: Integrated formulas calculate the intrinsic value of SINOPEC using the Discounted Cash Flow method.
- ⚡ Instant Results: Visualize SINOPEC’s valuation immediately after adjustments are made.
- Scenario Analysis: Evaluate and compare outcomes based on different financial assumptions side-by-side.
How It Works
- Download the Template: Gain immediate access to the Excel-based SINOPEC Engineering (Group) DCF Calculator.
- Input Your Assumptions: Modify the yellow-highlighted cells for growth rates, WACC, margins, and additional parameters.
- Instant Calculations: The model automatically computes SINOPEC's intrinsic value.
- Test Scenarios: Experiment with various assumptions to assess potential valuation variations.
- Analyze and Decide: Utilize the outcomes to inform your investment or financial assessments.
Why Choose This Calculator for SINOPEC Engineering (Group) Co., Ltd. (2386HK)?
- User-Friendly Interface: Crafted for both novices and seasoned professionals.
- Customizable Inputs: Effortlessly adjust parameters to suit your analysis needs.
- Real-Time Adjustments: Instantly view changes in SINOPEC’s valuation as you modify inputs.
- Preloaded Data: Comes equipped with SINOPEC’s actual financial metrics for swift evaluations.
- Relied Upon by Experts: A preferred tool for investors and analysts making well-informed decisions.
Who Can Benefit from This Product?
- Engineering Students: Explore engineering principles and apply them to real-life case studies.
- Researchers: Utilize advanced models to enhance your academic work and studies.
- Investors: Validate your investment hypotheses and evaluate the performance of SINOPEC Engineering (2386HK).
- Industry Analysts: Improve your analysis efficiency with a customizable engineering model at your fingertips.
- Small Business Owners: Understand the evaluation methods used for large engineering firms like SINOPEC Engineering (2386HK).
Contents of the Template
- Pre-Filled Data: Contains SINOPEC Engineering's historical financial figures and projections.
- Discounted Cash Flow Model: Editable DCF valuation model with automated calculations.
- Weighted Average Cost of Capital (WACC): A dedicated worksheet for computing WACC using customizable inputs.
- Key Financial Ratios: Evaluate SINOPEC Engineering's profitability, efficiency, and leverage metrics.
- Customizable Inputs: Easily adjust revenue growth, profit margins, and tax rates.
- Intuitive Dashboard: Visuals and tables summarizing essential valuation outcomes.
Disclaimer
All information, articles, and product details provided on this website are for general informational and educational purposes only. We do not claim any ownership over, nor do we intend to infringe upon, any trademarks, copyrights, logos, brand names, or other intellectual property mentioned or depicted on this site. Such intellectual property remains the property of its respective owners, and any references here are made solely for identification or informational purposes, without implying any affiliation, endorsement, or partnership.
We make no representations or warranties, express or implied, regarding the accuracy, completeness, or suitability of any content or products presented. Nothing on this website should be construed as legal, tax, investment, financial, medical, or other professional advice. In addition, no part of this site—including articles or product references—constitutes a solicitation, recommendation, endorsement, advertisement, or offer to buy or sell any securities, franchises, or other financial instruments, particularly in jurisdictions where such activity would be unlawful.
All content is of a general nature and may not address the specific circumstances of any individual or entity. It is not a substitute for professional advice or services. Any actions you take based on the information provided here are strictly at your own risk. You accept full responsibility for any decisions or outcomes arising from your use of this website and agree to release us from any liability in connection with your use of, or reliance upon, the content or products found herein.