
|
BOC Hong Kong Limited (2388.HK) Avaliação DCF |
Totalmente Editável: Adapte-Se Às Suas Necessidades No Excel Ou Planilhas
Design Profissional: Modelos Confiáveis E Padrão Da Indústria
Pré-Construídos Para Uso Rápido E Eficiente
Compatível com MAC/PC, totalmente desbloqueado
Não É Necessária Experiência; Fácil De Seguir
BOC Hong Kong (Holdings) Limited (2388.HK) Bundle
Descubra o verdadeiro potencial do BOC Hong Kong (Holdings) Limited (2388HK) com nossa calculadora DCF avançada! Ajuste as principais suposições, explore vários cenários e examine como as mudanças afetam a avaliação Boc Hong Kong (Holdings) Limited (2388HK) - tudo dentro de um único modelo do Excel.
What You Will Receive
- Pre-Filled Financial Model: BOC Hong Kong (Holdings) Limited's actual data enables accurate DCF valuation.
- Comprehensive Forecast Control: Adjust revenue growth, profit margins, WACC, and other essential parameters.
- Real-Time Calculations: Automatic updates let you view results as you make modifications.
- Investor-Ready Template: A polished Excel file crafted for professional-grade valuation.
- Customizable and Repeatable: Designed for versatility, allowing ongoing use for detailed forecasts.
Key Features
- Authentic BOC Hong Kong Data: Pre-loaded with the company’s historical financials and anticipated future projections.
- Completely Customizable Parameters: Tailor revenue growth, profit margins, WACC, tax rates, and capital expenditures to your needs.
- Interactive Valuation Model: Real-time updates to Net Present Value (NPV) and intrinsic value based on user-defined inputs.
- Scenario Analysis: Develop various forecasting scenarios to evaluate different valuation results.
- Intuitive User Interface: Designed for ease of use, making it suitable for both professionals and newcomers.
How It Functions
- Download: Obtain the pre-formatted Excel file containing BOC Hong Kong (Holdings) Limited (2388HK) financial data.
- Customize: Modify your forecasts for revenue growth, EBITDA margin, and WACC as needed.
- Update Automatically: Enjoy real-time updates for intrinsic value and NPV calculations.
- Test Scenarios: Develop various projections and instantly compare the results.
- Make Decisions: Utilize the valuation findings to inform your investment approach.
Why Opt for BOC Hong Kong (Holdings) Limited (2388HK) Calculator?
- Time Efficient: Get started instantly without the hassle of building a DCF model from scratch.
- Enhanced Precision: Utilize dependable financial data and formulas to minimize valuation errors.
- Completely Customizable: Adjust the model to fit your specific assumptions and forecasts.
- User-Friendly: Intuitive charts and outputs make it simple to interpret the results.
- Endorsed by Professionals: Crafted for experts who prioritize accuracy and ease of use.
Who Can Benefit from This Product?
- Finance Students: Master valuation techniques and apply them to real-world data.
- Academics: Integrate industry-standard models into your curriculum or research projects.
- Investors: Validate your assumptions and evaluate valuation results for BOC Hong Kong (Holdings) Limited (2388HK).
- Analysts: Enhance your productivity with a ready-to-use, customizable DCF model.
- Small Business Owners: Discover how major public companies, such as BOC Hong Kong (Holdings) Limited, are analyzed.
What the Template Contains
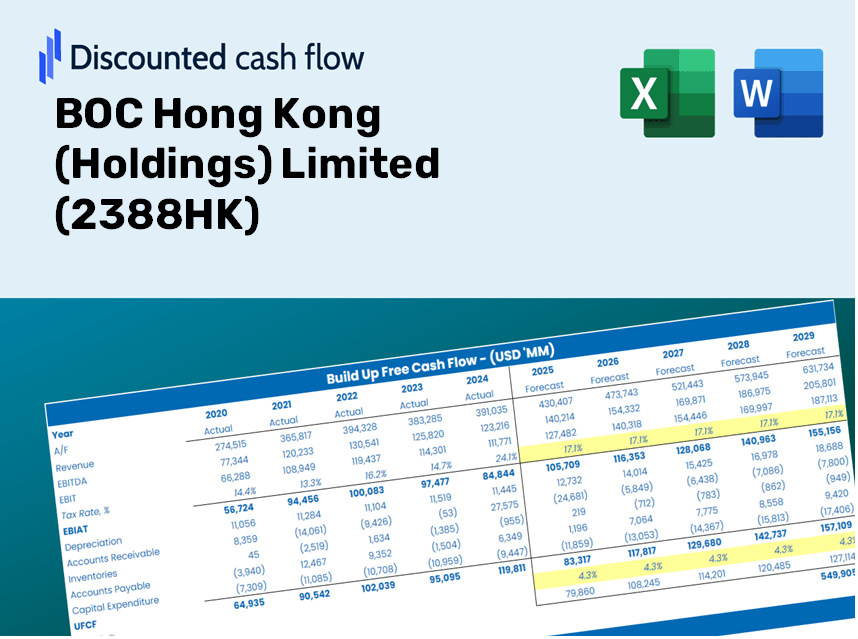
- Operating and Balance Sheet Data: Pre-filled historical data and forecasts for BOC Hong Kong (Holdings) Limited (2388HK), including metrics such as revenue, EBITDA, EBIT, and capital expenditures.
- WACC Calculation: A dedicated sheet for the Weighted Average Cost of Capital (WACC), featuring key parameters like Beta, risk-free rate, and share price.
- DCF Valuation (Unlevered and Levered): Customizable Discounted Cash Flow models that display intrinsic value with comprehensive calculations.
- Financial Statements: Pre-loaded annual and quarterly financial statements designed to facilitate in-depth analysis.
- Key Ratios: A collection of profitability, leverage, and efficiency ratios specifically for BOC Hong Kong (Holdings) Limited (2388HK).
- Dashboard and Charts: A visual summary of valuation outputs and assumptions to simplify the analysis of results.
Disclaimer
All information, articles, and product details provided on this website are for general informational and educational purposes only. We do not claim any ownership over, nor do we intend to infringe upon, any trademarks, copyrights, logos, brand names, or other intellectual property mentioned or depicted on this site. Such intellectual property remains the property of its respective owners, and any references here are made solely for identification or informational purposes, without implying any affiliation, endorsement, or partnership.
We make no representations or warranties, express or implied, regarding the accuracy, completeness, or suitability of any content or products presented. Nothing on this website should be construed as legal, tax, investment, financial, medical, or other professional advice. In addition, no part of this site—including articles or product references—constitutes a solicitation, recommendation, endorsement, advertisement, or offer to buy or sell any securities, franchises, or other financial instruments, particularly in jurisdictions where such activity would be unlawful.
All content is of a general nature and may not address the specific circumstances of any individual or entity. It is not a substitute for professional advice or services. Any actions you take based on the information provided here are strictly at your own risk. You accept full responsibility for any decisions or outcomes arising from your use of this website and agree to release us from any liability in connection with your use of, or reliance upon, the content or products found herein.