
|
M3, Inc. (2413.T) Avaliação DCF |
Totalmente Editável: Adapte-Se Às Suas Necessidades No Excel Ou Planilhas
Design Profissional: Modelos Confiáveis E Padrão Da Indústria
Pré-Construídos Para Uso Rápido E Eficiente
Compatível com MAC/PC, totalmente desbloqueado
Não É Necessária Experiência; Fácil De Seguir
M3, Inc. (2413.T) Bundle
Aprimore suas opções de investimento com a calculadora DCF M3, Inc. (2413T)! Utilize dados financeiros precisos da M3, ajuste as previsões e despesas do crescimento e observe instantaneamente como essas modificações influenciam o valor intrínseco de M3, Inc. (2413T).
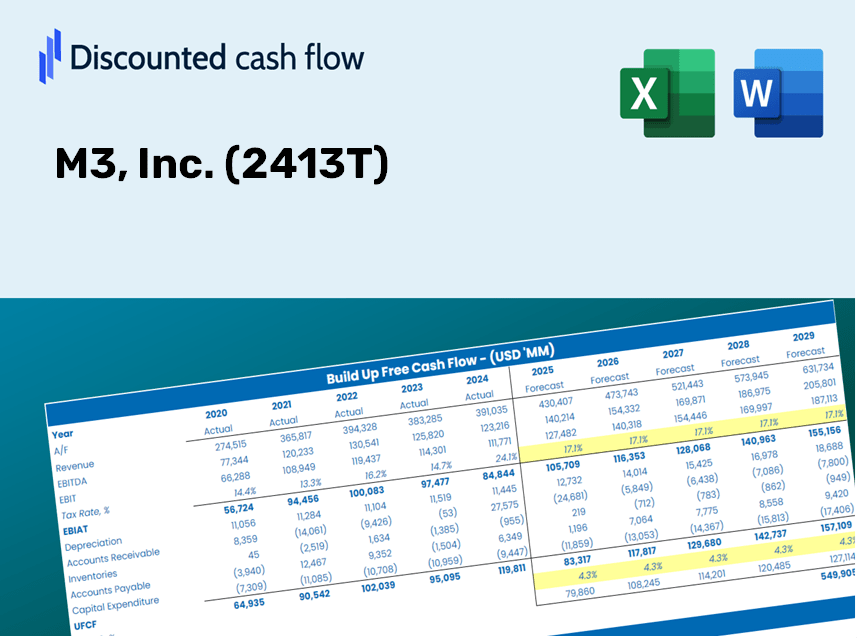
Discounted Cash Flow (DCF) - (USD MM)
| Year | AY1 2021 |
AY2 2022 |
AY3 2023 |
AY4 2024 |
AY5 2025 |
FY1 2026 |
FY2 2027 |
FY3 2028 |
FY4 2029 |
FY5 2030 |
|---|---|---|---|---|---|---|---|---|---|---|
| Revenue | 169,198.0 | 208,159.0 | 230,818.0 | 238,883.0 | 284,900.0 | 325,263.1 | 371,344.5 | 423,954.6 | 484,018.1 | 552,591.2 |
| Revenue Growth, % | 0 | 23.03 | 10.89 | 3.49 | 19.26 | 14.17 | 14.17 | 14.17 | 14.17 | 14.17 |
| EBITDA | 64,078.0 | 104,591.0 | 80,349.0 | 76,752.0 | 75,035.0 | 118,002.0 | 134,719.9 | 153,806.3 | 175,596.7 | 200,474.2 |
| EBITDA, % | 37.87 | 50.25 | 34.81 | 32.13 | 26.34 | 36.28 | 36.28 | 36.28 | 36.28 | 36.28 |
| Depreciation | 5,737.0 | 6,274.0 | 7,434.0 | 8,878.0 | 12,205.0 | 11,466.1 | 13,090.6 | 14,945.2 | 17,062.5 | 19,479.8 |
| Depreciation, % | 3.39 | 3.01 | 3.22 | 3.72 | 4.28 | 3.53 | 3.53 | 3.53 | 3.53 | 3.53 |
| EBIT | 58,341.0 | 98,317.0 | 72,915.0 | 67,874.0 | 62,830.0 | 106,535.9 | 121,629.3 | 138,861.1 | 158,534.2 | 180,994.4 |
| EBIT, % | 34.48 | 47.23 | 31.59 | 28.41 | 22.05 | 32.75 | 32.75 | 32.75 | 32.75 | 32.75 |
| Total Cash | 115,398.0 | 141,216.0 | 146,388.0 | 179,828.0 | 134,933.0 | 209,537.7 | 239,223.9 | 273,115.8 | 311,809.3 | 355,984.8 |
| Total Cash, percent | .0 | .0 | .0 | .0 | .0 | .0 | .0 | .0 | .0 | .0 |
| Account Receivables | 43,676.0 | 50,879.0 | 50,537.0 | 51,928.0 | 65,047.0 | 75,929.4 | 86,686.7 | 98,968.0 | 112,989.2 | 128,996.9 |
| Account Receivables, % | 25.81 | 24.44 | 21.89 | 21.74 | 22.83 | 23.34 | 23.34 | 23.34 | 23.34 | 23.34 |
| Inventories | 1,652.0 | 1,846.0 | 1,975.0 | .0 | .0 | 1,768.7 | 2,019.3 | 2,305.3 | 2,631.9 | 3,004.8 |
| Inventories, % | 0.97637 | 0.88682 | 0.85565 | 0 | 0 | 0.54377 | 0.54377 | 0.54377 | 0.54377 | 0.54377 |
| Accounts Payable | 5,371.0 | 8,808.0 | 5,799.0 | 38,877.0 | 49,941.0 | 28,442.3 | 32,471.8 | 37,072.2 | 42,324.4 | 48,320.7 |
| Accounts Payable, % | 3.17 | 4.23 | 2.51 | 16.27 | 17.53 | 8.74 | 8.74 | 8.74 | 8.74 | 8.74 |
| Capital Expenditure | -1,989.0 | -3,217.0 | -7,577.0 | -7,581.0 | -6,290.0 | -7,406.2 | -8,455.5 | -9,653.4 | -11,021.1 | -12,582.5 |
| Capital Expenditure, % | -1.18 | -1.55 | -3.28 | -3.17 | -2.21 | -2.28 | -2.28 | -2.28 | -2.28 | -2.28 |
| Tax Rate, % | 34.82 | 34.82 | 34.82 | 34.82 | 34.82 | 34.82 | 34.82 | 34.82 | 34.82 | 34.82 |
| EBITAT | 37,872.0 | 65,258.8 | 48,102.4 | 44,635.7 | 40,951.3 | 69,930.6 | 79,838.0 | 91,149.0 | 104,062.5 | 118,805.5 |
| Depreciation | ||||||||||
| Changes in Account Receivables | ||||||||||
| Changes in Inventories | ||||||||||
| Changes in Accounts Payable | ||||||||||
| Capital Expenditure | ||||||||||
| UFCF | 1,663.0 | 64,355.8 | 45,163.4 | 79,594.7 | 44,811.3 | 39,840.6 | 77,494.7 | 88,473.7 | 101,008.2 | 115,318.5 |
| WACC, % | 10.33 | 10.34 | 10.33 | 10.33 | 10.33 | 10.33 | 10.33 | 10.33 | 10.33 | 10.33 |
| PV UFCF | ||||||||||
| SUM PV UFCF | 304,315.9 | |||||||||
| Long Term Growth Rate, % | 2.00 | |||||||||
| Free cash flow (T + 1) | 117,625 | |||||||||
| Terminal Value | 1,411,273 | |||||||||
| Present Terminal Value | 863,080 | |||||||||
| Enterprise Value | 1,167,396 | |||||||||
| Net Debt | -110,513 | |||||||||
| Equity Value | 1,277,909 | |||||||||
| Diluted Shares Outstanding, MM | 679 | |||||||||
| Equity Value Per Share | 1,881.42 |
What You'll Receive
- Genuine M3 Financials: Access to both historical and projected data for precise valuation.
- Customizable Parameters: Adjust metrics like WACC, tax rates, revenue growth, and capital expenditures.
- Real-Time Calculations: Intrinsic value and NPV are computed automatically.
- Scenario Planning: Explore various scenarios to assess M3's future performance.
- User-Friendly Design: Crafted for professionals while remaining approachable for newcomers.
Key Features
- Customizable Forecast Metrics: Adjust essential inputs such as revenue growth, EBITDA percentage, and capital expenditures.
- Instant DCF Valuation: Quickly computes intrinsic value, net present value (NPV), and additional outputs.
- High-Precision Accuracy: Leverages M3, Inc.'s (2413T) actual financial data for credible valuation results.
- Simplified Scenario Analysis: Effortlessly evaluate various assumptions and compare results.
- Efficiency-Boosting Tool: Remove the complexity of creating detailed valuation models from the ground up.
How It Works
- Step 1: Download the Excel file.
- Step 2: Review M3, Inc.'s pre-filled financial data and projections.
- Step 3: Adjust key inputs such as revenue growth, WACC, and tax rates (highlighted cells).
- Step 4: Observe the DCF model update in real-time as you modify your assumptions.
- Step 5: Evaluate the outputs and leverage the findings for your investment choices.
Why Opt for M3, Inc. ([2413T]) Calculator?
- Time Efficient: Skip the hassle of building a DCF model from the ground up – it's ready for immediate use.
- Enhanced Precision: Dependable financial data and formulas help minimize valuation errors.
- Fully Adaptable: Customize the model to align with your specific assumptions and forecasts.
- User-Friendly: Intuitive charts and outputs facilitate straightforward analysis of the results.
- Preferred by Professionals: Crafted for experts who prioritize accuracy and practicality.
Who Can Benefit from M3, Inc. (2413T)?
- Individual Investors: Gain insights to make informed decisions on buying or selling M3, Inc. (2413T) shares.
- Financial Analysts: Enhance valuation processes with comprehensive, ready-to-use financial models tailored for M3, Inc. (2413T).
- Consultants: Provide clients with quick and precise valuation analyses of M3, Inc. (2413T).
- Business Owners: Learn from M3, Inc. (2413T)'s valuation practices to inform your own business strategy.
- Finance Students: Master valuation techniques by studying real-world data and scenarios related to M3, Inc. (2413T).
Contents of the Template
- Operating and Balance Sheet Data: Comprehensive historical data and forecasts for M3, Inc. (2413T), encompassing revenue, EBITDA, EBIT, and capital expenditures.
- WACC Calculation: A specialized sheet for calculating the Weighted Average Cost of Capital (WACC), featuring key parameters such as Beta, risk-free rate, and share price.
- DCF Valuation (Unlevered and Levered): Customizable Discounted Cash Flow models that illustrate intrinsic value, complete with detailed calculations.
- Financial Statements: Pre-populated financial statements (both annual and quarterly) to facilitate thorough analysis.
- Key Ratios: A selection of profitability, leverage, and efficiency ratios specific to M3, Inc. (2413T).
- Dashboard and Charts: A visual overview of valuation outputs and underlying assumptions for straightforward result analysis.
Disclaimer
All information, articles, and product details provided on this website are for general informational and educational purposes only. We do not claim any ownership over, nor do we intend to infringe upon, any trademarks, copyrights, logos, brand names, or other intellectual property mentioned or depicted on this site. Such intellectual property remains the property of its respective owners, and any references here are made solely for identification or informational purposes, without implying any affiliation, endorsement, or partnership.
We make no representations or warranties, express or implied, regarding the accuracy, completeness, or suitability of any content or products presented. Nothing on this website should be construed as legal, tax, investment, financial, medical, or other professional advice. In addition, no part of this site—including articles or product references—constitutes a solicitation, recommendation, endorsement, advertisement, or offer to buy or sell any securities, franchises, or other financial instruments, particularly in jurisdictions where such activity would be unlawful.
All content is of a general nature and may not address the specific circumstances of any individual or entity. It is not a substitute for professional advice or services. Any actions you take based on the information provided here are strictly at your own risk. You accept full responsibility for any decisions or outcomes arising from your use of this website and agree to release us from any liability in connection with your use of, or reliance upon, the content or products found herein.