
|
Concord HealthCare Grp Co Ltd (2453.HK) Avaliação DCF |
Totalmente Editável: Adapte-Se Às Suas Necessidades No Excel Ou Planilhas
Design Profissional: Modelos Confiáveis E Padrão Da Indústria
Pré-Construídos Para Uso Rápido E Eficiente
Compatível com MAC/PC, totalmente desbloqueado
Não É Necessária Experiência; Fácil De Seguir
Concord Healthcare Grp Co Ltd (2453.HK) Bundle
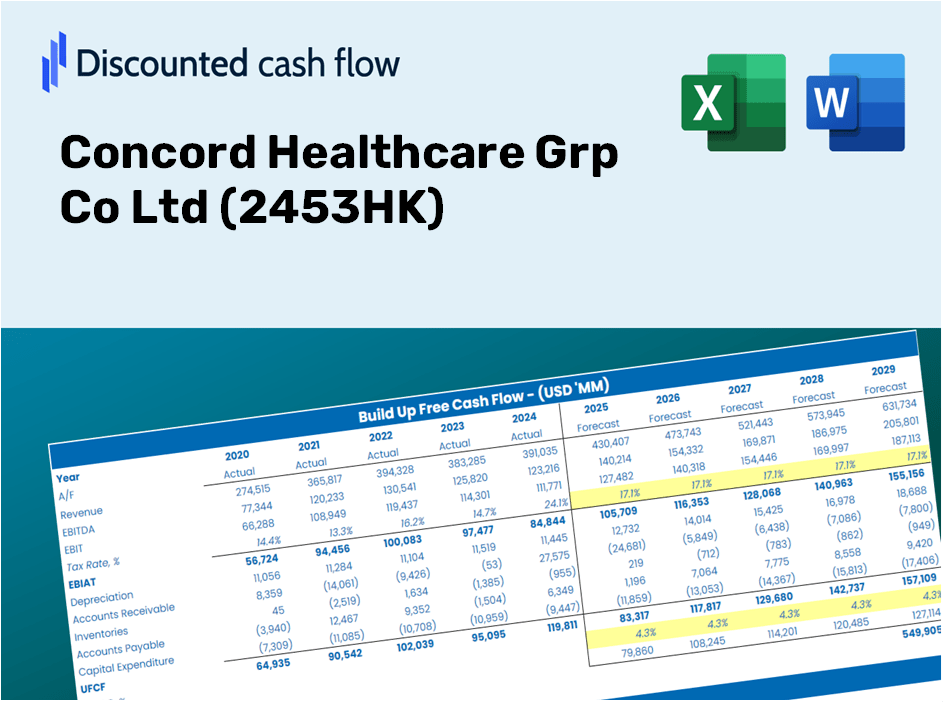
Procurando avaliar o valor intrínseco do Concord HealthCare Grp Co Ltd? Nossa calculadora DCF (2453HK) integra dados do mundo real com opções abrangentes de personalização, permitindo ajustar as previsões e aprimorar suas estratégias de investimento.
Discounted Cash Flow (DCF) - (USD MM)
| Year | AY1 2020 |
AY2 2021 |
AY3 2022 |
AY4 2023 |
AY5 2024 |
FY1 2025 |
FY2 2026 |
FY3 2027 |
FY4 2028 |
FY5 2029 |
|---|---|---|---|---|---|---|---|---|---|---|
| Revenue | 181.8 | 514.2 | 516.0 | 588.7 | 424.4 | 516.2 | 627.8 | 763.6 | 928.8 | 1,129.7 |
| Revenue Growth, % | 0 | 182.89 | 0.35388 | 14.08 | -27.91 | 21.63 | 21.63 | 21.63 | 21.63 | 21.63 |
| EBITDA | -250.5 | -389.3 | -388.5 | -188.6 | -212.5 | -343.9 | -418.3 | -508.8 | -618.8 | -752.7 |
| EBITDA, % | -137.8 | -75.72 | -75.29 | -32.04 | -50.08 | -66.63 | -66.63 | -66.63 | -66.63 | -66.63 |
| Depreciation | 61.9 | 91.6 | 124.9 | 166.1 | 124.7 | 138.0 | 167.8 | 204.1 | 248.3 | 302.0 |
| Depreciation, % | 34.05 | 17.81 | 24.2 | 28.22 | 29.37 | 26.73 | 26.73 | 26.73 | 26.73 | 26.73 |
| EBIT | -312.4 | -480.9 | -513.4 | -354.7 | -337.2 | -446.7 | -543.3 | -660.9 | -803.8 | -977.7 |
| EBIT, % | -171.85 | -93.53 | -99.5 | -60.26 | -79.45 | -86.55 | -86.55 | -86.55 | -86.55 | -86.55 |
| Total Cash | 464.3 | 148.7 | 148.7 | 53.8 | 368.4 | 261.9 | 318.5 | 387.4 | 471.3 | 573.2 |
| Total Cash, percent | .0 | .0 | .0 | .0 | .0 | .0 | .0 | .0 | .0 | .0 |
| Account Receivables | 62.5 | 150.2 | 119.5 | 83.0 | 211.0 | 155.4 | 189.1 | 230.0 | 279.7 | 340.2 |
| Account Receivables, % | 34.38 | 29.21 | 23.16 | 14.11 | 49.72 | 30.11 | 30.11 | 30.11 | 30.11 | 30.11 |
| Inventories | 23.6 | 41.6 | 92.7 | 44.1 | 36.5 | 57.0 | 69.3 | 84.3 | 102.5 | 124.6 |
| Inventories, % | 13.01 | 8.09 | 17.97 | 7.49 | 8.61 | 11.03 | 11.03 | 11.03 | 11.03 | 11.03 |
| Accounts Payable | 19.3 | 110.6 | 159.4 | 138.9 | 122.6 | 119.3 | 145.1 | 176.4 | 214.6 | 261.0 |
| Accounts Payable, % | 10.64 | 21.52 | 30.89 | 23.59 | 28.88 | 23.1 | 23.1 | 23.1 | 23.1 | 23.1 |
| Capital Expenditure | -943.8 | -688.6 | -89.6 | -200.8 | -343.3 | -343.1 | -417.3 | -507.6 | -617.4 | -751.0 |
| Capital Expenditure, % | -519.23 | -133.92 | -17.37 | -34.11 | -80.9 | -66.48 | -66.48 | -66.48 | -66.48 | -66.48 |
| Tax Rate, % | 8.77 | 8.77 | 8.77 | 8.77 | 8.77 | 8.77 | 8.77 | 8.77 | 8.77 | 8.77 |
| EBITAT | -304.8 | -469.6 | -429.5 | -305.9 | -307.6 | -407.7 | -495.9 | -603.2 | -733.6 | -892.3 |
| Depreciation | ||||||||||
| Changes in Account Receivables | ||||||||||
| Changes in Inventories | ||||||||||
| Changes in Accounts Payable | ||||||||||
| Capital Expenditure | ||||||||||
| UFCF | -1,253.4 | -1,081.0 | -365.9 | -276.1 | -663.0 | -581.0 | -765.6 | -931.2 | -1,132.6 | -1,377.6 |
| WACC, % | 3.86 | 3.86 | 3.54 | 3.6 | 3.71 | 3.71 | 3.71 | 3.71 | 3.71 | 3.71 |
| PV UFCF | ||||||||||
| SUM PV UFCF | -4,233.5 | |||||||||
| Long Term Growth Rate, % | 2.00 | |||||||||
| Free cash flow (T + 1) | -1,405 | |||||||||
| Terminal Value | -82,010 | |||||||||
| Present Terminal Value | -68,343 | |||||||||
| Enterprise Value | -72,577 | |||||||||
| Net Debt | 3,284 | |||||||||
| Equity Value | -75,861 | |||||||||
| Diluted Shares Outstanding, MM | 715 | |||||||||
| Equity Value Per Share | -106.03 |
What You Will Receive
- Customizable Excel Template: A fully adjustable Excel-based DCF Calculator featuring pre-filled financials for Concord Healthcare Grp Co Ltd (2453HK).
- Accurate Data: Access to historical data alongside forward-looking projections (highlighted in the yellow cells).
- Adjustable Forecasts: Modify key assumptions such as revenue growth, EBITDA %, and WACC as needed.
- Instant Calculations: Quickly observe how your inputs affect the valuation of Concord Healthcare Grp Co Ltd (2453HK).
- Professional Resource: Designed specifically for investors, CFOs, consultants, and financial analysts.
- Intuitive Layout: Organized for simplicity and usability, complete with step-by-step guidance.
Key Features
- Pre-Loaded Data: Concord Healthcare's historical financial statements and pre-filled forecasts.
- Fully Adjustable Inputs: Modify WACC, tax rates, revenue growth, and EBITDA margins as needed.
- Instant Results: View Concord Healthcare's intrinsic value recalculate in real time.
- Clear Visual Outputs: Dashboard charts present valuation results and essential metrics.
- Built for Accuracy: A professional tool designed for analysts, investors, and finance experts.
How It Works
- Step 1: Download the Excel file.
- Step 2: Review the pre-filled Concord Healthcare data (historical and projected).
- Step 3: Modify key assumptions (yellow cells) according to your analysis.
- Step 4: Observe automatic recalculations for Concord Healthcare's intrinsic value.
- Step 5: Utilize the results for investment decisions or reporting.
Why Choose This Calculator for Concord Healthcare Grp Co Ltd (2453HK)?
- User-Friendly Interface: Perfectly crafted for both novices and seasoned professionals.
- Customizable Inputs: Adjust parameters easily to tailor your analysis.
- Live Updates: View immediate changes to Concord Healthcare’s valuation with adjusted inputs.
- Preloaded Financial Data: Comes with Concord Healthcare’s actual data for swift evaluations.
- Relied Upon by Experts: A tool trusted by investors and analysts for making well-informed decisions.
Who Can Benefit from This Product?
- Individual Investors: Gain insights for making informed decisions regarding buying or selling Concord Healthcare Grp Co Ltd (2453HK) stock.
- Financial Analysts: Enhance valuation processes with comprehensive financial models tailored for Concord Healthcare Grp Co Ltd (2453HK).
- Consultants: Provide clients with accurate and timely valuation insights related to Concord Healthcare Grp Co Ltd (2453HK).
- Business Owners: Learn how to assess the valuation of large companies like Concord Healthcare Grp Co Ltd (2453HK) to inform your own business strategy.
- Finance Students: Master valuation techniques by analyzing real-world data and case studies from Concord Healthcare Grp Co Ltd (2453HK).
What the Template Contains
- Historical Data: Contains Concord Healthcare's past financial performance and baseline forecasts.
- DCF and Levered DCF Models: Comprehensive templates to assess the intrinsic value of Concord Healthcare.
- WACC Sheet: Pre-calibrated calculations for the Weighted Average Cost of Capital.
- Editable Inputs: Customize key parameters such as growth rates, EBITDA %, and CAPEX assumptions.
- Quarterly and Annual Statements: A thorough breakdown of Concord Healthcare's financial statements.
- Interactive Dashboard: Dynamically visualize valuation outcomes and projections.
Disclaimer
All information, articles, and product details provided on this website are for general informational and educational purposes only. We do not claim any ownership over, nor do we intend to infringe upon, any trademarks, copyrights, logos, brand names, or other intellectual property mentioned or depicted on this site. Such intellectual property remains the property of its respective owners, and any references here are made solely for identification or informational purposes, without implying any affiliation, endorsement, or partnership.
We make no representations or warranties, express or implied, regarding the accuracy, completeness, or suitability of any content or products presented. Nothing on this website should be construed as legal, tax, investment, financial, medical, or other professional advice. In addition, no part of this site—including articles or product references—constitutes a solicitation, recommendation, endorsement, advertisement, or offer to buy or sell any securities, franchises, or other financial instruments, particularly in jurisdictions where such activity would be unlawful.
All content is of a general nature and may not address the specific circumstances of any individual or entity. It is not a substitute for professional advice or services. Any actions you take based on the information provided here are strictly at your own risk. You accept full responsibility for any decisions or outcomes arising from your use of this website and agree to release us from any liability in connection with your use of, or reliance upon, the content or products found herein.