
|
XXF GRUPO Holdings Ltd (2473.HK) Avaliação DCF |
Totalmente Editável: Adapte-Se Às Suas Necessidades No Excel Ou Planilhas
Design Profissional: Modelos Confiáveis E Padrão Da Indústria
Pré-Construídos Para Uso Rápido E Eficiente
Compatível com MAC/PC, totalmente desbloqueado
Não É Necessária Experiência; Fácil De Seguir
XXF Group Holdings Ltd (2473.HK) Bundle
Explore as perspectivas financeiras do XXF Group Holdings Ltd (2473HK) com nossa calculadora DCF amigável! Digite suas projeções de crescimento, margens e despesas para calcular o valor intrínseco da XXF Group Holdings Ltd (2473HK) e refine sua abordagem de investimento.
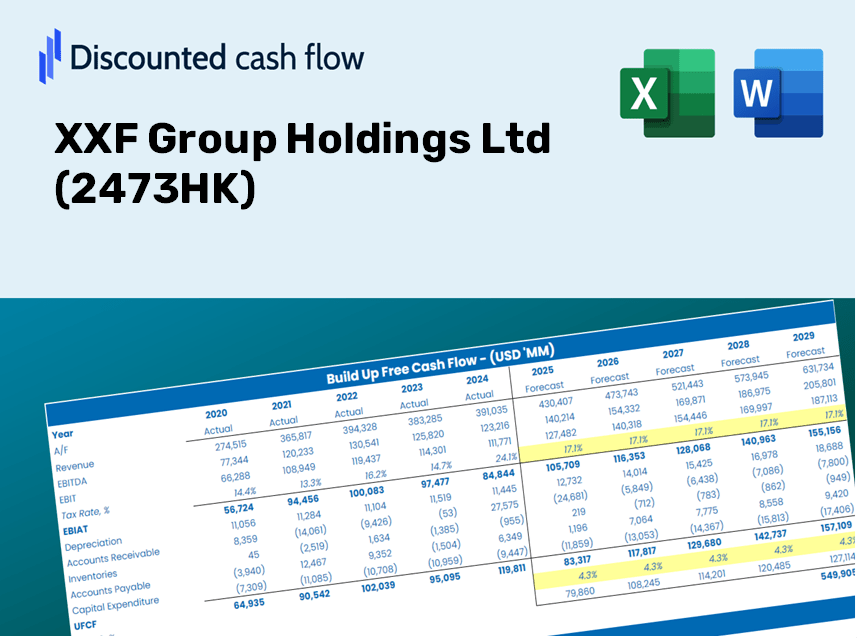
Discounted Cash Flow (DCF) - (USD MM)
| Year | AY1 2020 |
AY2 2021 |
AY3 2022 |
AY4 2023 |
AY5 2024 |
FY1 2025 |
FY2 2026 |
FY3 2027 |
FY4 2028 |
FY5 2029 |
|---|---|---|---|---|---|---|---|---|---|---|
| Revenue | 819.8 | 1,280.7 | 1,248.1 | 1,426.2 | 1,274.5 | 1,457.1 | 1,665.8 | 1,904.5 | 2,177.3 | 2,489.3 |
| Revenue Growth, % | 0 | 56.22 | -2.54 | 14.26 | -10.64 | 14.33 | 14.33 | 14.33 | 14.33 | 14.33 |
| EBITDA | 250.8 | 305.5 | 380.1 | 458.2 | 353.2 | 421.8 | 482.2 | 551.3 | 630.3 | 720.6 |
| EBITDA, % | 30.59 | 23.86 | 30.45 | 32.13 | 27.71 | 28.95 | 28.95 | 28.95 | 28.95 | 28.95 |
| Depreciation | 106.4 | 127.5 | 122.3 | 137.9 | 117.9 | 150.5 | 172.1 | 196.8 | 225.0 | 257.2 |
| Depreciation, % | 12.98 | 9.96 | 9.8 | 9.67 | 9.25 | 10.33 | 10.33 | 10.33 | 10.33 | 10.33 |
| EBIT | 144.3 | 178.0 | 257.8 | 320.4 | 235.3 | 271.3 | 310.1 | 354.6 | 405.4 | 463.4 |
| EBIT, % | 17.6 | 13.9 | 20.65 | 22.46 | 18.46 | 18.62 | 18.62 | 18.62 | 18.62 | 18.62 |
| Total Cash | 27.7 | 113.3 | 240.1 | 313.7 | 372.4 | 240.9 | 275.5 | 314.9 | 360.0 | 411.6 |
| Total Cash, percent | .0 | .0 | .0 | .0 | .0 | .0 | .0 | .0 | .0 | .0 |
| Account Receivables | 422.2 | 515.1 | 623.2 | 764.4 | 63.8 | 583.6 | 667.2 | 762.8 | 872.1 | 997.0 |
| Account Receivables, % | 51.5 | 40.22 | 49.93 | 53.6 | 5.01 | 40.05 | 40.05 | 40.05 | 40.05 | 40.05 |
| Inventories | 201.0 | 222.1 | 279.8 | 238.8 | 188.2 | 279.1 | 319.1 | 364.8 | 417.1 | 476.9 |
| Inventories, % | 24.52 | 17.34 | 22.41 | 16.74 | 14.77 | 19.16 | 19.16 | 19.16 | 19.16 | 19.16 |
| Accounts Payable | 45.4 | 74.9 | 115.7 | 148.2 | 88.1 | 110.6 | 126.5 | 144.6 | 165.3 | 189.0 |
| Accounts Payable, % | 5.54 | 5.85 | 9.27 | 10.39 | 6.91 | 7.59 | 7.59 | 7.59 | 7.59 | 7.59 |
| Capital Expenditure | -196.8 | -62.4 | -163.1 | -223.6 | -158.2 | -204.1 | -233.4 | -266.8 | -305.0 | -348.7 |
| Capital Expenditure, % | -24.01 | -4.88 | -13.07 | -15.68 | -12.41 | -14.01 | -14.01 | -14.01 | -14.01 | -14.01 |
| Tax Rate, % | 25.1 | 25.1 | 25.1 | 25.1 | 25.1 | 25.1 | 25.1 | 25.1 | 25.1 | 25.1 |
| EBITAT | 84.9 | 141.2 | 221.7 | 272.0 | 176.2 | 208.3 | 238.2 | 272.3 | 311.3 | 355.9 |
| Depreciation | ||||||||||
| Changes in Account Receivables | ||||||||||
| Changes in Inventories | ||||||||||
| Changes in Accounts Payable | ||||||||||
| Capital Expenditure | ||||||||||
| UFCF | -583.2 | 121.7 | 56.0 | 118.5 | 827.0 | -433.5 | 69.1 | 79.1 | 90.4 | 103.3 |
| WACC, % | 4.59 | 4.82 | 4.9 | 4.89 | 4.77 | 4.79 | 4.79 | 4.79 | 4.79 | 4.79 |
| PV UFCF | ||||||||||
| SUM PV UFCF | -125.3 | |||||||||
| Long Term Growth Rate, % | 2.00 | |||||||||
| Free cash flow (T + 1) | 105 | |||||||||
| Terminal Value | 3,772 | |||||||||
| Present Terminal Value | 2,984 | |||||||||
| Enterprise Value | 2,859 | |||||||||
| Net Debt | 2,134 | |||||||||
| Equity Value | 725 | |||||||||
| Diluted Shares Outstanding, MM | 1,623 | |||||||||
| Equity Value Per Share | 0.45 |
What You Will Gain
- Authentic XXF Data: Comprehensive financials – covering everything from revenue to EBIT – derived from actual and projected statistics.
- Complete Customization: Modify all essential parameters (highlighted cells) such as WACC, growth rates, and tax percentages.
- Immediate Valuation Adjustments: Automatic recalculations to assess the effects of changes on the fair value of XXF Group Holdings Ltd (2473HK).
- Flexible Excel Template: Designed for rapid modifications, scenario evaluations, and in-depth forecasts.
- Efficient and Precise: Eliminate the need to start modeling from scratch while ensuring accuracy and adaptability.
Key Features
- Comprehensive DCF Calculator: Offers detailed unlevered and levered DCF valuation models tailored for XXF Group Holdings Ltd (2473HK).
- WACC Calculator: Features a pre-built Weighted Average Cost of Capital sheet that allows for customizable inputs specific to XXF Group Holdings Ltd (2473HK).
- Customizable Forecast Assumptions: Adjust growth rates, capital expenditures, and discount rates to fit the needs of XXF Group Holdings Ltd (2473HK).
- Integrated Financial Ratios: Evaluate profitability, leverage, and efficiency ratios specifically for XXF Group Holdings Ltd (2473HK).
- Interactive Dashboard and Charts: Visual outputs provide a summary of key valuation metrics, facilitating easy analysis for XXF Group Holdings Ltd (2473HK).
How It Works
- Step 1: Download the Excel file.
- Step 2: Review XXF Group Holdings Ltd's pre-filled financial data and forecasts.
- Step 3: Adjust key inputs such as revenue growth, WACC, and tax rates (highlighted cells).
- Step 4: Observe the DCF model update in real-time as you make changes to the assumptions.
- Step 5: Evaluate the outputs and leverage the results for investment decisions.
Why Opt for This Calculator?
- All-in-One Solution: Incorporates DCF, WACC, and financial ratio assessments seamlessly.
- Flexible Inputs: Modify the yellow-highlighted fields to explore different scenarios.
- In-Depth Analysis: Automatically determines the intrinsic value and Net Present Value of XXF Group Holdings Ltd (2473HK).
- Preloaded Information: Historical and projected data provide reliable starting metrics.
- High-Quality Standards: Perfect for financial analysts, investors, and business advisors.
Who Can Benefit from XXF Group Holdings Ltd (2473HK)?
- Finance Students: Master valuation methods and implement them with real-world data.
- Researchers: Integrate industry-standard models into your academic projects or studies.
- Investors: Validate your investment hypotheses and assess valuation outcomes for XXF Group Holdings Ltd (2473HK).
- Financial Analysts: Enhance your efficiency with a ready-made, versatile DCF model.
- Entrepreneurs: Understand the analytical approaches used for large corporations like XXF Group Holdings Ltd (2473HK).
Contents of the Template
- Preloaded XXF Data: Historical and projected financial information, including revenue, EBIT, and capital expenditures.
- DCF and WACC Models: Professional-quality spreadsheets designed for calculating intrinsic value and Weighted Average Cost of Capital.
- Editable Inputs: Cells highlighted in yellow for modifying revenue growth, tax rates, and discount rates.
- Financial Statements: Detailed annual and quarterly financial reports for in-depth analysis.
- Key Ratios: Metrics for profitability, leverage, and efficiency to assess overall performance.
- Dashboard and Charts: Visual representations of valuation results and underlying assumptions.
Disclaimer
All information, articles, and product details provided on this website are for general informational and educational purposes only. We do not claim any ownership over, nor do we intend to infringe upon, any trademarks, copyrights, logos, brand names, or other intellectual property mentioned or depicted on this site. Such intellectual property remains the property of its respective owners, and any references here are made solely for identification or informational purposes, without implying any affiliation, endorsement, or partnership.
We make no representations or warranties, express or implied, regarding the accuracy, completeness, or suitability of any content or products presented. Nothing on this website should be construed as legal, tax, investment, financial, medical, or other professional advice. In addition, no part of this site—including articles or product references—constitutes a solicitation, recommendation, endorsement, advertisement, or offer to buy or sell any securities, franchises, or other financial instruments, particularly in jurisdictions where such activity would be unlawful.
All content is of a general nature and may not address the specific circumstances of any individual or entity. It is not a substitute for professional advice or services. Any actions you take based on the information provided here are strictly at your own risk. You accept full responsibility for any decisions or outcomes arising from your use of this website and agree to release us from any liability in connection with your use of, or reliance upon, the content or products found herein.