
|
Kirin Holdings Company, Limited (2503.T) Avaliação DCF |
Totalmente Editável: Adapte-Se Às Suas Necessidades No Excel Ou Planilhas
Design Profissional: Modelos Confiáveis E Padrão Da Indústria
Pré-Construídos Para Uso Rápido E Eficiente
Compatível com MAC/PC, totalmente desbloqueado
Não É Necessária Experiência; Fácil De Seguir
Kirin Holdings Company, Limited (2503.T) Bundle
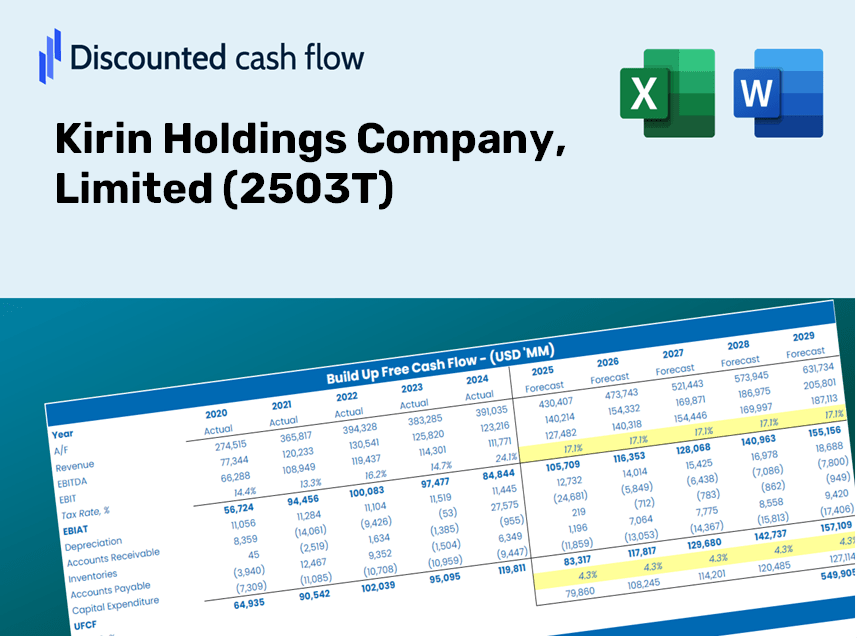
Avalie a Kirin Holdings Company, as perspectivas financeiras da Limited como um especialista! Essa calculadora (2503T) DCF fornece dados financeiros pré-preenchidos e flexibilidade para modificar o crescimento da receita, o WACC, as margens e outras suposições críticas para se alinhar às suas projeções.
Discounted Cash Flow (DCF) - (USD MM)
| Year | AY1 2020 |
AY2 2021 |
AY3 2022 |
AY4 2023 |
AY5 2024 |
FY1 2025 |
FY2 2026 |
FY3 2027 |
FY4 2028 |
FY5 2029 |
|---|---|---|---|---|---|---|---|---|---|---|
| Revenue | 1,849,545.0 | 1,821,570.0 | 1,989,468.0 | 2,134,393.0 | 2,338,385.0 | 2,481,883.9 | 2,634,188.9 | 2,795,840.2 | 2,967,411.7 | 3,149,511.8 |
| Revenue Growth, % | 0 | -1.51 | 9.22 | 7.28 | 9.56 | 6.14 | 6.14 | 6.14 | 6.14 | 6.14 |
| EBITDA | 189,230.0 | 150,704.0 | 260,362.0 | 294,799.0 | 253,417.0 | 279,165.2 | 296,296.7 | 314,479.4 | 333,778.0 | 354,260.8 |
| EBITDA, % | 10.23 | 8.27 | 13.09 | 13.81 | 10.84 | 11.25 | 11.25 | 11.25 | 11.25 | 11.25 |
| Depreciation | 82,109.0 | 81,130.0 | 85,937.0 | 87,227.0 | 95,702.0 | 106,186.2 | 112,702.5 | 119,618.6 | 126,959.2 | 134,750.3 |
| Depreciation, % | 4.44 | 4.45 | 4.32 | 4.09 | 4.09 | 4.28 | 4.28 | 4.28 | 4.28 | 4.28 |
| EBIT | 107,121.0 | 69,574.0 | 174,425.0 | 207,572.0 | 157,715.0 | 172,979.1 | 183,594.2 | 194,860.8 | 206,818.7 | 219,510.5 |
| EBIT, % | 5.79 | 3.82 | 8.77 | 9.73 | 6.74 | 6.97 | 6.97 | 6.97 | 6.97 | 6.97 |
| Total Cash | 161,667.0 | 157,398.0 | 96,436.0 | 140,343.0 | 127,187.0 | 169,976.4 | 180,407.3 | 191,478.3 | 203,228.7 | 215,700.2 |
| Total Cash, percent | .0 | .0 | .0 | .0 | .0 | .0 | .0 | .0 | .0 | .0 |
| Account Receivables | 372,146.0 | 387,921.0 | 409,168.0 | 444,940.0 | 502,880.0 | 517,896.1 | 549,677.6 | 583,409.5 | 619,211.4 | 657,210.3 |
| Account Receivables, % | 20.12 | 21.3 | 20.57 | 20.85 | 21.51 | 20.87 | 20.87 | 20.87 | 20.87 | 20.87 |
| Inventories | 217,176.0 | 247,229.0 | 290,171.0 | 330,984.0 | 358,985.0 | 351,230.2 | 372,784.1 | 395,660.6 | 419,941.0 | 445,711.3 |
| Inventories, % | 11.74 | 13.57 | 14.59 | 15.51 | 15.35 | 14.15 | 14.15 | 14.15 | 14.15 | 14.15 |
| Accounts Payable | 220,277.0 | 229,552.0 | 265,185.0 | 137,263.0 | 364,265.0 | 297,080.3 | 315,311.1 | 334,660.7 | 355,197.7 | 376,995.0 |
| Accounts Payable, % | 11.91 | 12.6 | 13.33 | 6.43 | 15.58 | 11.97 | 11.97 | 11.97 | 11.97 | 11.97 |
| Capital Expenditure | -93,026.0 | -86,335.0 | -98,479.0 | -113,810.0 | -180,584.0 | -137,864.0 | -146,324.3 | -155,303.7 | -164,834.2 | -174,949.5 |
| Capital Expenditure, % | -5.03 | -4.74 | -4.95 | -5.33 | -7.72 | -5.55 | -5.55 | -5.55 | -5.55 | -5.55 |
| Tax Rate, % | 58.34 | 58.34 | 58.34 | 58.34 | 58.34 | 58.34 | 58.34 | 58.34 | 58.34 | 58.34 |
| EBITAT | 61,868.7 | 41,758.2 | 101,168.8 | 118,715.4 | 65,711.1 | 95,011.9 | 100,842.4 | 107,030.8 | 113,598.9 | 120,570.1 |
| Depreciation | ||||||||||
| Changes in Account Receivables | ||||||||||
| Changes in Inventories | ||||||||||
| Changes in Accounts Payable | ||||||||||
| Capital Expenditure | ||||||||||
| UFCF | -318,093.3 | .2 | 60,070.8 | -112,374.6 | 121,890.1 | -11,112.0 | 32,116.0 | 34,086.9 | 36,178.7 | 38,398.9 |
| WACC, % | 3.83 | 3.86 | 3.83 | 3.82 | 3.64 | 3.8 | 3.8 | 3.8 | 3.8 | 3.8 |
| PV UFCF | ||||||||||
| SUM PV UFCF | 112,625.1 | |||||||||
| Long Term Growth Rate, % | 2.00 | |||||||||
| Free cash flow (T + 1) | 39,167 | |||||||||
| Terminal Value | 2,179,801 | |||||||||
| Present Terminal Value | 1,809,243 | |||||||||
| Enterprise Value | 1,921,868 | |||||||||
| Net Debt | 738,952 | |||||||||
| Equity Value | 1,182,916 | |||||||||
| Diluted Shares Outstanding, MM | 810 | |||||||||
| Equity Value Per Share | 1,460.49 |
What You Will Receive
- Customizable Excel Template: A fully adaptable Excel-based DCF Calculator featuring pre-filled real financial data for Kirin Holdings Company, Limited (2503T).
- Authentic Data: Access to historical data and forward-looking projections (highlighted in the yellow cells).
- Flexible Forecasting: Modify forecast parameters such as revenue growth, EBITDA %, and WACC.
- Instant Calculations: Instantly observe how your inputs affect the valuation of Kirin Holdings Company, Limited (2503T).
- Professional Resource: Designed for investors, CFOs, consultants, and financial analysts.
- User-Friendly Layout: Organized for clarity and ease of navigation, complete with step-by-step guidance.
Key Features
- 🔍 Real-Life KHC Financials: Pre-filled historical and projected data for Kirin Holdings Company, Limited (2503T).
- ✏️ Fully Customizable Inputs: Modify all essential parameters (yellow cells) such as WACC, growth %, and tax rates.
- 📊 Professional DCF Valuation: Integrated formulas calculate Kirin's intrinsic value using the Discounted Cash Flow method.
- ⚡ Instant Results: Visualize Kirin's valuation instantly after implementing changes.
- Scenario Analysis: Evaluate and compare results for various financial assumptions side-by-side.
How It Operates
- Step 1: Download the Excel file.
- Step 2: Examine Kirin Holdings' pre-filled financial data and projections.
- Step 3: Adjust key inputs such as revenue growth, WACC, and tax rates (highlighted cells).
- Step 4: Observe the DCF model update in real-time as you modify your assumptions.
- Step 5: Evaluate the results and utilize the findings for your investment strategies.
Why Choose This Calculator for Kirin Holdings Company, Limited (2503T)?
- Accuracy: Utilize real Kirin financial data for precise calculations.
- Flexibility: Tailored to allow users to test and adjust inputs with ease.
- Time-Saving: Avoid the complexities of constructing a DCF model from the ground up.
- Professional-Grade: Crafted with the expertise and usability expected by CFOs.
- User-Friendly: Intuitive design ensures accessibility, even for those new to financial modeling.
Who Can Benefit from Kirin Holdings Company, Limited (2503T)?
- Investors: Make informed choices with a top-tier valuation tool tailored for Kirin Holdings (2503T).
- Financial Analysts: Streamline your workflow with a ready-to-customize DCF model designed for Kirin Holdings (2503T).
- Consultants: Easily modify the template for effective client presentations or detailed reports on Kirin Holdings (2503T).
- Finance Enthusiasts: Enhance your grasp of valuation methods using real-world case studies from Kirin Holdings (2503T).
- Educators and Students: Utilize it as a hands-on learning resource in finance courses focused on Kirin Holdings (2503T).
Contents of the Template
- Comprehensive DCF Model: An editable template featuring detailed valuation calculations.
- Real-World Data: Kirin Holdings Company's (2503T) historical and projected financials included for in-depth analysis.
- Customizable Parameters: Modify WACC, growth rates, and tax assumptions to explore various scenarios.
- Financial Statements: Complete annual and quarterly breakdowns for enhanced insights.
- Key Ratios: Integrated analysis covering profitability, efficiency, and leverage metrics.
- Dashboard with Visual Outputs: Visual representations including charts and tables for clear, actionable insights.
Disclaimer
All information, articles, and product details provided on this website are for general informational and educational purposes only. We do not claim any ownership over, nor do we intend to infringe upon, any trademarks, copyrights, logos, brand names, or other intellectual property mentioned or depicted on this site. Such intellectual property remains the property of its respective owners, and any references here are made solely for identification or informational purposes, without implying any affiliation, endorsement, or partnership.
We make no representations or warranties, express or implied, regarding the accuracy, completeness, or suitability of any content or products presented. Nothing on this website should be construed as legal, tax, investment, financial, medical, or other professional advice. In addition, no part of this site—including articles or product references—constitutes a solicitation, recommendation, endorsement, advertisement, or offer to buy or sell any securities, franchises, or other financial instruments, particularly in jurisdictions where such activity would be unlawful.
All content is of a general nature and may not address the specific circumstances of any individual or entity. It is not a substitute for professional advice or services. Any actions you take based on the information provided here are strictly at your own risk. You accept full responsibility for any decisions or outcomes arising from your use of this website and agree to release us from any liability in connection with your use of, or reliance upon, the content or products found herein.