
|
Takara Holdings Inc. (2531.T) Avaliação DCF |
Totalmente Editável: Adapte-Se Às Suas Necessidades No Excel Ou Planilhas
Design Profissional: Modelos Confiáveis E Padrão Da Indústria
Pré-Construídos Para Uso Rápido E Eficiente
Compatível com MAC/PC, totalmente desbloqueado
Não É Necessária Experiência; Fácil De Seguir
Takara Holdings Inc. (2531.T) Bundle
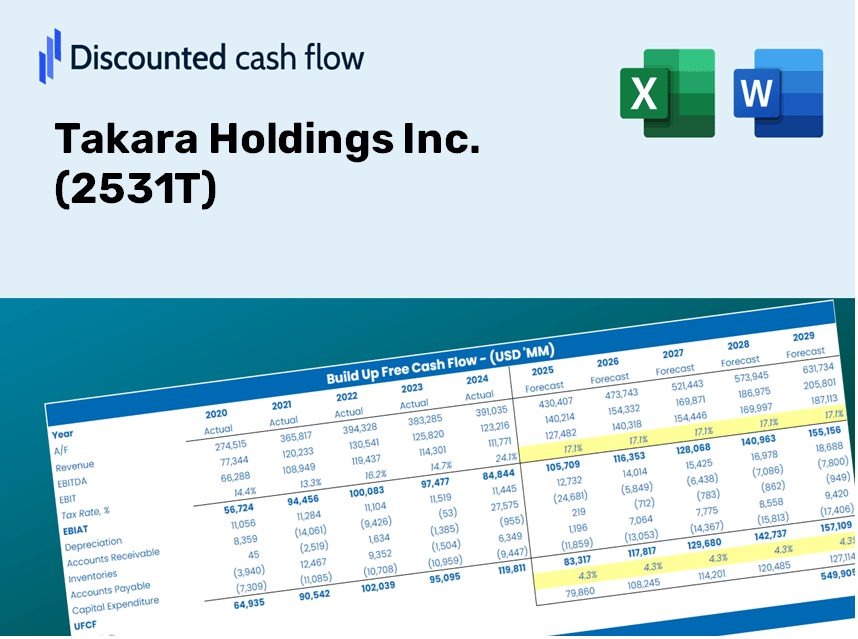
Obtenha informações sobre sua análise de avaliação Takara Holdings Inc. (2531T) usando nossa sofisticada calculadora DCF! Apresentando dados em tempo real para (2531t), este modelo do Excel permite ajustar as previsões e suposições para determinar com precisão o valor intrínseco da Takara Holdings Inc.
What You Will Receive
- Authentic Takara Holdings Data: Preloaded financials – covering everything from revenue to EBIT – based on real and projected statistics.
- Comprehensive Customization: Modify all key parameters (yellow cells) such as WACC, growth %, and tax rates.
- Immediate Valuation Updates: Automatic recalculations to assess the effects of changes on Takara Holdings' fair value.
- Flexible Excel Template: Designed for quick adjustments, scenario analysis, and in-depth forecasting.
- Efficient and Accurate: Bypass the hassle of building models from scratch while ensuring accuracy and adaptability.
Key Features
- Advanced DCF Calculator: Offers comprehensive unlevered and levered DCF valuation models tailored for Takara Holdings Inc. (2531T).
- WACC Calculator: Features a pre-designed Weighted Average Cost of Capital sheet with adjustable inputs specifically for Takara Holdings Inc. (2531T).
- Customizable Forecast Assumptions: Adjust growth rates, capital expenditures, and discount rates according to your analysis needs for Takara Holdings Inc. (2531T).
- Integrated Financial Ratios: Evaluate profitability, leverage, and efficiency ratios related to Takara Holdings Inc. (2531T).
- Interactive Dashboard and Charts: Visual representations provide a summary of key valuation metrics for quick assessment of Takara Holdings Inc. (2531T).
How It Works
- Step 1: Download the Excel file for Takara Holdings Inc. (2531T).
- Step 2: Examine the pre-filled financial data and forecasts provided for Takara Holdings.
- Step 3: Adjust key inputs such as revenue growth, WACC, and tax rates (highlighted cells).
- Step 4: Observe the DCF model refresh in real-time as you modify your assumptions.
- Step 5: Evaluate the results and employ the findings to inform your investment decisions.
Why Choose Takara Holdings Inc. (2531T) Calculator?
- Save Time: Skip the hassle of building a DCF model from the ground up – it's ready for immediate use.
- Enhance Accuracy: Dependable financial data and formulas minimize valuation errors.
- Completely Customizable: Adjust the model to align with your unique assumptions and forecasts.
- User-Friendly: Intuitive charts and outputs facilitate straightforward analysis of results.
- Endorsed by Professionals: Crafted for industry experts who prioritize precision and ease of use.
Who Can Benefit from Takara Holdings Inc. (2531T)?
- Finance Students: Master valuation techniques and apply them to real-world data effectively.
- Academics: Enhance your coursework or research with professional models tailored for Takara Holdings Inc. (2531T).
- Investors: Evaluate your hypotheses and analyze valuation outcomes related to Takara Holdings Inc. (2531T).
- Analysts: Optimize your processes with a customizable, pre-built DCF model specifically for Takara Holdings Inc. (2531T).
- Small Business Owners: Understand the analytical approaches used for evaluating large public companies like Takara Holdings Inc. (2531T).
Contents of the Template
- Preloaded Takara Holdings Inc. Data: Historical and projected financial metrics, including revenue, EBIT, and capital expenditures.
- DCF and WACC Models: Advanced sheets designed for calculating intrinsic value and Weighted Average Cost of Capital.
- Customizable Inputs: Cells highlighted in yellow for modifying revenue growth, tax rates, and discount rates.
- Financial Statements: Detailed annual and quarterly financial reports for in-depth analysis.
- Key Ratios: Comprehensive profitability, leverage, and efficiency ratios for performance evaluation.
- Dashboard and Charts: Visual representations of valuation results and underlying assumptions.
Disclaimer
All information, articles, and product details provided on this website are for general informational and educational purposes only. We do not claim any ownership over, nor do we intend to infringe upon, any trademarks, copyrights, logos, brand names, or other intellectual property mentioned or depicted on this site. Such intellectual property remains the property of its respective owners, and any references here are made solely for identification or informational purposes, without implying any affiliation, endorsement, or partnership.
We make no representations or warranties, express or implied, regarding the accuracy, completeness, or suitability of any content or products presented. Nothing on this website should be construed as legal, tax, investment, financial, medical, or other professional advice. In addition, no part of this site—including articles or product references—constitutes a solicitation, recommendation, endorsement, advertisement, or offer to buy or sell any securities, franchises, or other financial instruments, particularly in jurisdictions where such activity would be unlawful.
All content is of a general nature and may not address the specific circumstances of any individual or entity. It is not a substitute for professional advice or services. Any actions you take based on the information provided here are strictly at your own risk. You accept full responsibility for any decisions or outcomes arising from your use of this website and agree to release us from any liability in connection with your use of, or reliance upon, the content or products found herein.